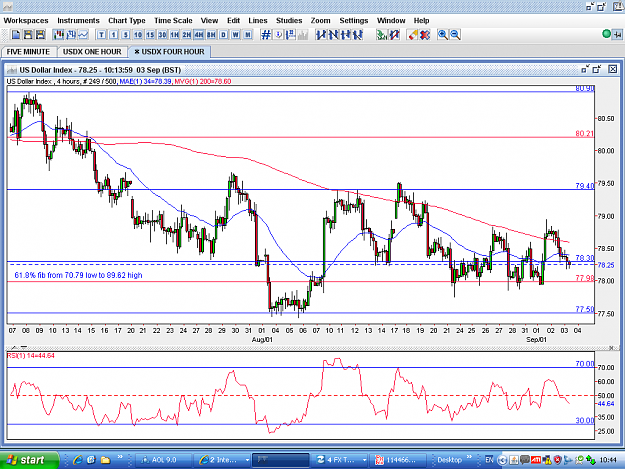
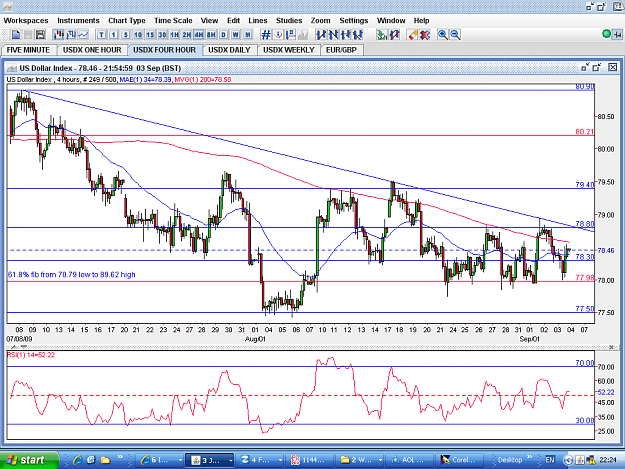
This is a continuation of an ICCE chart which I trade since some weeks.
We see clear support areas (red) built on the top and bottom lines of the ICCE box which was photo copied on 26 Aug. (second box).
It was a a good take during this London-NY session to buy at the first Support level indicated, in case that PA would hve gone to the second level (1.4220 level) I would have added to that position.
The ICCE boxes and their Fib levels should be seen as areas in which we act when we think the support or Resistance hold.
We are in a range since 19. Aug and it is forming a Mega ICCE (the blue sqare line). The upper level is the bottom line of a previous ICCE box from the first days of Aug.
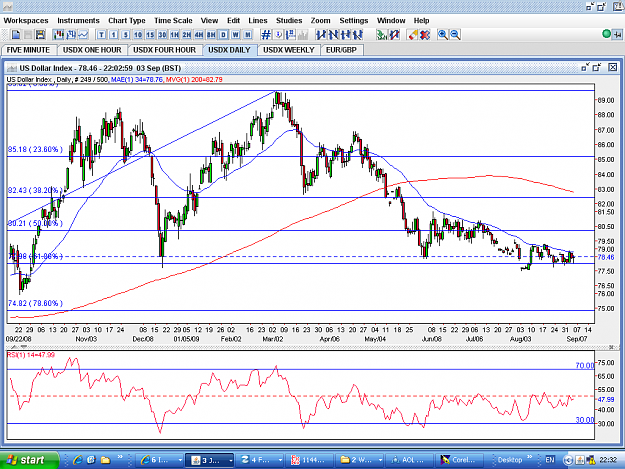
Attached Image (click to enlarge)