two charts: h4 and daily.
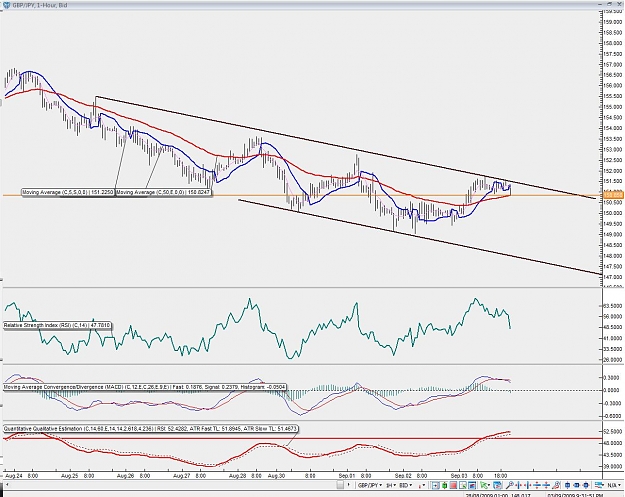
again, for the bullish gang: h4 chart shows that price is at a very important resistance: 151.50 area. as i pointed out already, the higher it may go and still have a bearish bias is 151.95. as long as we do not see a break there, 152 or whatever above is not possible.
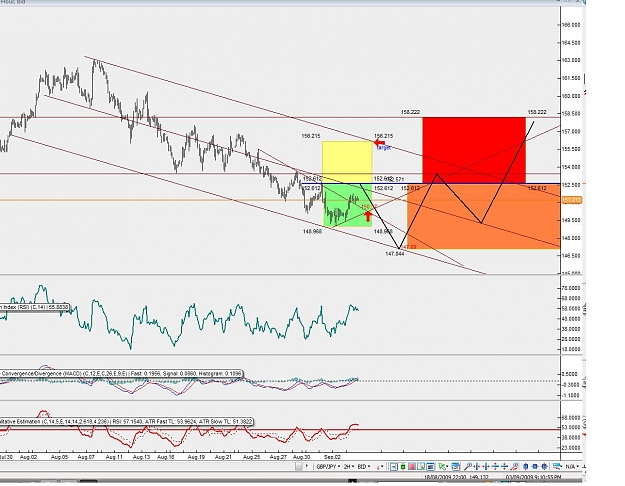
daily chart shows where next resistance is located, IF 152 is taken: 154.80 area.
now, if 151.95 stays in place, then next level is 147.10 area. that's enough for now. let's see how this plays out.
again, for the bullish gang: h4 chart shows that price is at a very important resistance: 151.50 area. as i pointed out already, the higher it may go and still have a bearish bias is 151.95. as long as we do not see a break there, 152 or whatever above is not possible.
daily chart shows where next resistance is located, IF 152 is taken: 154.80 area.
now, if 151.95 stays in place, then next level is 147.10 area. that's enough for now. let's see how this plays out.
Attached Image(s) (click to enlarge)
Nihil Sine Deo.