DislikedMaybe PA, wave action, and S&R are so important, the rest is just decoration.Ignored
I think that the above sentence is the heart of the matter.
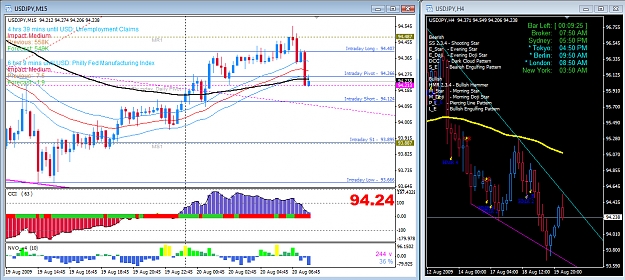
Personally, I trade with a naked 15M TF chart. I do keep and eye on a SonicR chart from time to time. Even that template is "bare bones." I use the 34 EMA dragon, Basber's Floor Pivots with mid-pivot levels, and the H1 channel on the price pane, and below I have only the Sonic CCI set to 63. I use the colors that Rastaman came up with on a white background because they are easy on my eyes (I have difficulty with black background charts).
I do not use fibs, I do not use 89 ema, I do not use volume, or any of the other indi's that other Sonikers place on their charts.
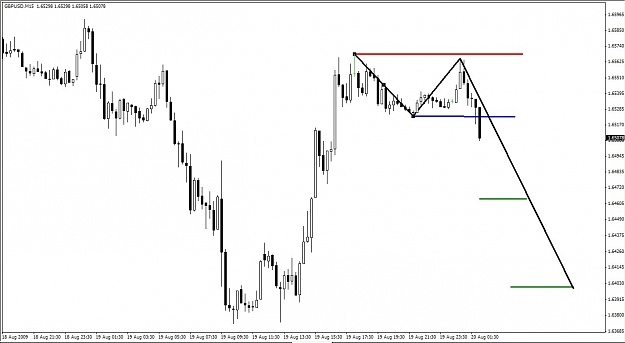
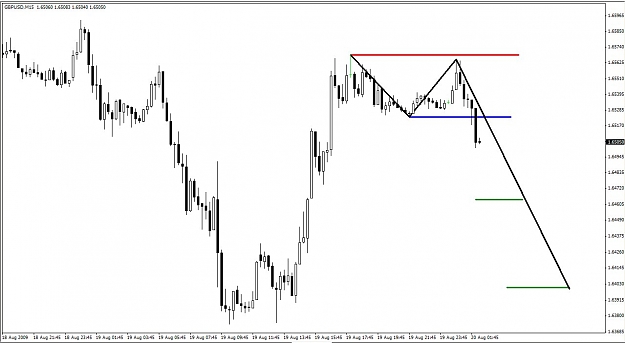
90% of my screen time is a naked 15m chart with no indi's. I do draw horizontal trendlines for S/R.
I guess what I am getting at is this: the SonicR is really based on PA and wave analysis for a trigger and S/R for stop loss and take profits. I would bet that Sonic would agree with me that if you understand the PA, wave analysis, and S/R of his system, you can trade SonicR without the indi's.
I do think that you are on to something with your use of the 34 SMA. I think it might help give a better confirmation of a possible counter trend SonicR set-up after a sharp run up or a sharp decline than the 34 EMA. However, you can still catch these moves without the indicators.
You see, TAH, any indicator, including volume indicators, are derived from price action, and because they are derivitive, they lag price action as well. All that any indicator does is apply a mathematical calculation to the values found in the price pane of your chart. All indicators are developed to help the trader see what he or she is unable to see in price action. Once the trader learns to read price action, then the indicators should just confirm what one is in fact seeing. In fact, because indicators are derivitive and lagging, often the indicators will be in conflict with what the trader is reading from price action. Once you get to the point where you recognize that the indicators are starting to keep you from taking trades that price action signals that you should take, you are ready to throw away the indicators.
Indicators are like training wheels on a bicycle. In the beginning, when we are first learning to ride, the training wheels help us keep our balance, stay on course, and prevent us from hurting ourselves. Once we learn how to keep our balance, stay on course, and remain upright on our own, the training wheels become a hindrance, and can actually become dangerous for the more skilled rider (a skilled bicylist can easily lean into take a fast, tight turn with a "naked bicycle," but put training wheels on the bicycle, and the same skilled rider taking leaning into the same fast turn catches the pavement and crashes).
You seem to be a very skilled rider to me, and I wonder if it isn't time you start to shed some of the training wheels. Why not try keeping a naked 15M chart side by side with your preferred SonicR template for a few weeks? I would suggest that you keep it plain - white background, with white candles up and black candles down. You might be very surprised at what you are able to see.