In this chart I did the same thing:
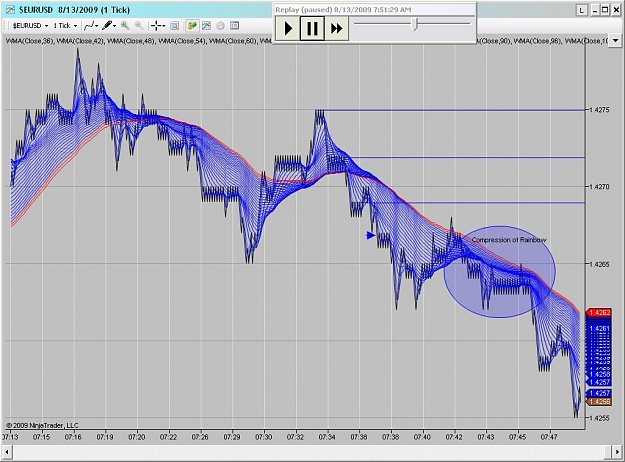
Wait for 3 consecutive S/R levels and then enter. What I didn't notice was a nearby COUNTER S/R level at 1.4265. However, here's several assumptions:
1. the rainbow looked pretty strong at that entry point and therefore I may perceive it as a strong enough downward trend to break past that counter S/R.
2. I looked at the rainbow at the 10 sec chart and it too looked strongly downward during that point.
The reason I marked the "compression of rainbow" on the chart was because I wanted all of your feedback.. What does that compression mean to you? During that point the 10 sec rainbow was strongly downward (no compression) so I may be able to assume that this compression on the 1 tick chart was nothing but a minor pause before continuing downward.
Let me know what your thoughts are on anything I've typed here..
Attached Image (click to enlarge)