DislikedSTRAT’s BOOT CAMP
Not having sufficient screen time to test my cycles stuff was becoming a worry for me especially as I saw how they reacted and were a little unstable on shorter time frames. I decided to ramp up my testing and give them the acid test – M5!
Although I needed a lot of movement and action, I didn’t need it so fast that I couldn’t decipher what was going on so I decided......Ignored
QuoteDislikedIf you have sat through a complete Asian trading session and are no better, knowledgeable or wiser for doing that then trading is not for you – take up tiddly winks or something equally passive!
Tiddly winks. LOL.
I'm "joining up" in STRAT'S BOOT CAMP today. I need all the training I can get.
One of my main confusions is to determine the S/R zones where price will be likely to react. To my untrained eye, there appears to be S/R all over the place.
Here is an example of what I mean.
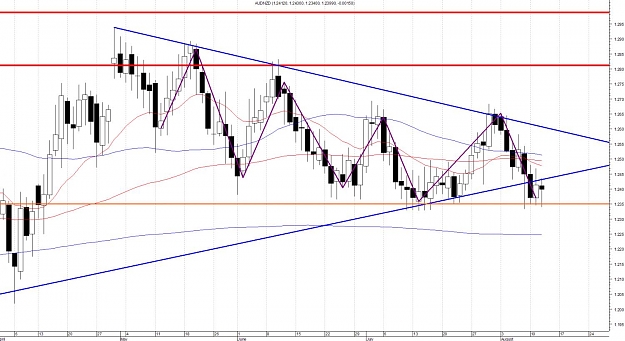
On the AUDUSD chart the swing high on June 03 has been exceeded and price apparently has retraced and tested the Daily SR at 0.8200 and formed a hammer. Not a good one, though. It is making a move upward presently, and if it breaks the top of the hammer it will confirm a swing low on the Daily chart.
The problem I have run into is that I'm not sure if this would be considered a good rejection off of SR, because price has not really closed near it, only the tail is near the "support" area. Would it be a higher probability trade to wait until there is a candle where price has closed closer to the SR area instead of having the close so far away from SR? Or is that not important?
Also, I know you have said many times that a hammer or shooting star has to be at the end of a downtrend or uptrend. Would the formation shown here, even though it's only seven candles from high to low (see downtrend line from 08/04 to 08/12) be enough to be considered a downtrend?
I also have questions about situations where price appears to break SR and how you approach that, but I will wait 'til later for that.
To some of you guys these questions may seem very elementary, but I hope you can bear with me until I learn. Thanks.
Here is the chart:
Attached Image (click to enlarge)