In this chart GG is not at right place, one thing which i already mentioned that as any peak or valley breaks that one does not remain highest or lowest. And until any peak or valley does not break that one remains highest or lowest.
DislikedHi WedWed and or Haiderfsd,
Please could you draw GG on a current (and NOT June 2009!) GBP/USD chart for clarification.
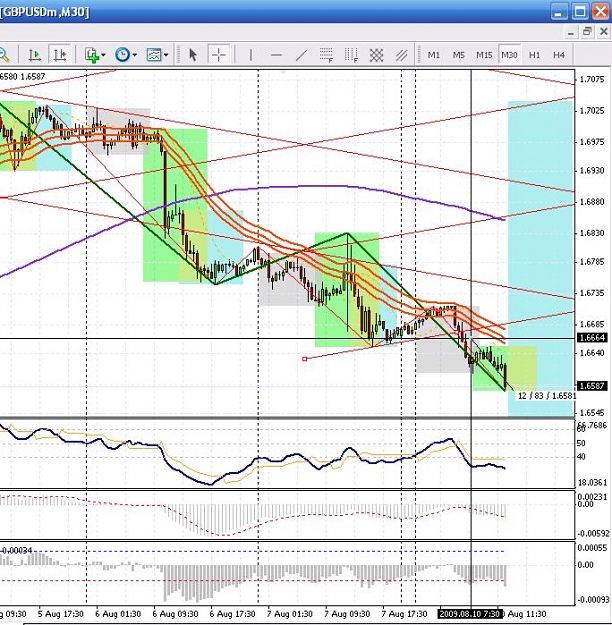
I am placing an attempted drawing here, but I can tell you upfront, that I could not draw the Neg-line. (My GG sometimes gives me an option of 2 points and sometimes not and I do not know why)
I used Point "A" as start as it represents in my mind's eye, a VALLEY whereas the LOW to the left of it, is just a Low. Comment plse.
Therefore Point "B" will be penetrating the NEG-line which I drew in Magenta @ midnight GMT...Ignored