Disliked....
I noticed after drawing the trendlines that it looks kind of like a triangle on EUR/USD. I am new at drawing the shapes and was wondering if I did that relatively well. If it breaks out the top it could also be breaking the top of of the W in the double bottom depending on where you draw your line.Ignored
it's a good practice to draw trendlines via price's lows/highs.
check out belekas' & aediaz1's posts & aediaz1's thread on S/R & trendlines to learn more.
QuoteDislikedThese good breakout trades with a retest?
QuoteDislikedA Small PB, What Did You Call It People ? SCPB ?! LOL. I Love Them Because Of The Small SL. But Damn With The Traffic ... I Don't Think There Will Be Any Trading Oppotunities In Majors Today.
Waiting ... The Most Hardest Part ...
yes, fairly small PB. may or may not be tradeable.
waiting for better trades is a good alternative.
More Patience = Less Risks (because of less Trades) = more Profits in the future for u!
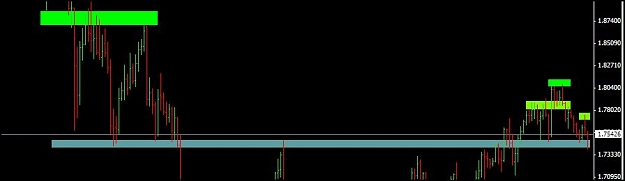
QuoteDislikedThe weekly IB on the GBPCHF chart broke today. Is this still valid considering the previous bar never broke it? See chart. This is my first chart post.
great to have your first chart post here.
not sure what specifically u are asking for. maybe u can rephrase it, so others can reply.
to me, the IB is the one after the doji looking candle (this doji is the "swing high" candle in that chart, the 3rd one counting from the last bar)