overlapping is one thing and anticipating wave 5 to go that far is another.
Ignored
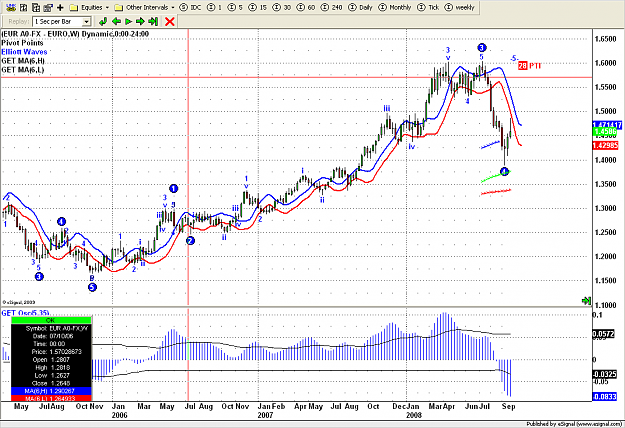
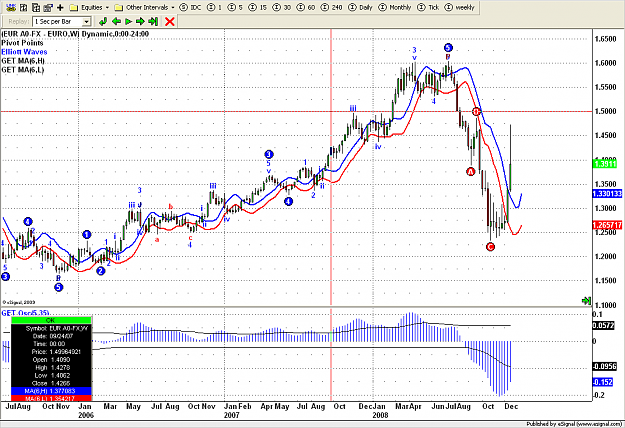
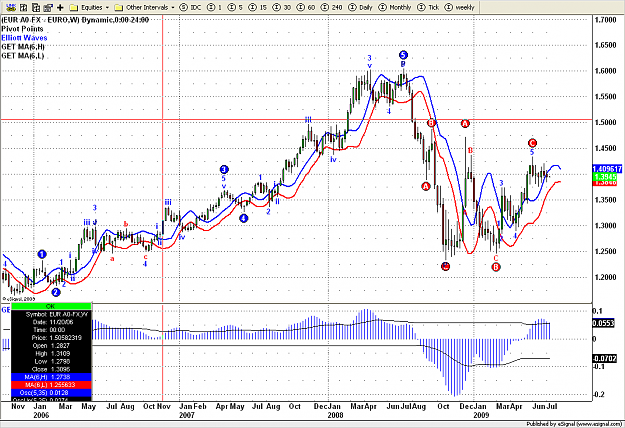
Based on what I have seen, similar to Elliott 5-wave pattern, trending overlap waves often (not always) move in 5 waves as well. And EURUSD weekly price has been moving quite well on the Elliott Wave pattern since wave-(3). So I think the odds are in favor of another wave up (wave-(5) in this case). That's my count only and I want to see how the others count on this chart as well
it that case there is no exact ratio of wave-(5) you have to look on internal and external relationships of your wave-(5) subdivisions, i add my daily chart where i think wave-(5) might end
Ignored
Thanks for the chart and comment Saras. Do you also have your count on the weekly?
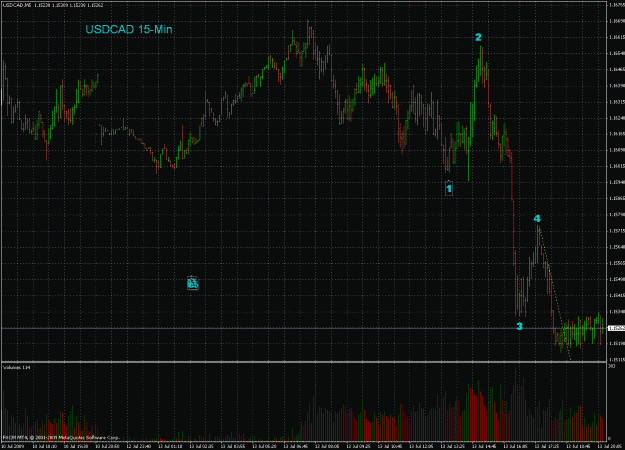
From 1992~2002 USDCAD also had a large degree 5-wave movement. I think that chart pattern has some similarities to today's weekly EURUSD chart. Just a thought.
it that case there is no exact ratio of wave-(5) you have to look on internal and external relationships of your wave-(5) subdivisions, i add my daily chart where i think wave-(5) might end
Ignored
Sarasxxx quite good count. I had the same becouse of channeling. But currently 0-2 line is broken (check it), and second thing is size of 4 wave - its a lot bigger than 2nd wave. I think there is small possibility to make this 5th wave up, but imho its really small. Try to count it like the 5th wave is finished, and currently we are doing B wave in downtrend - complicated B. I think it's so complicated becouse its B (correction) in D (triangle) - correction.
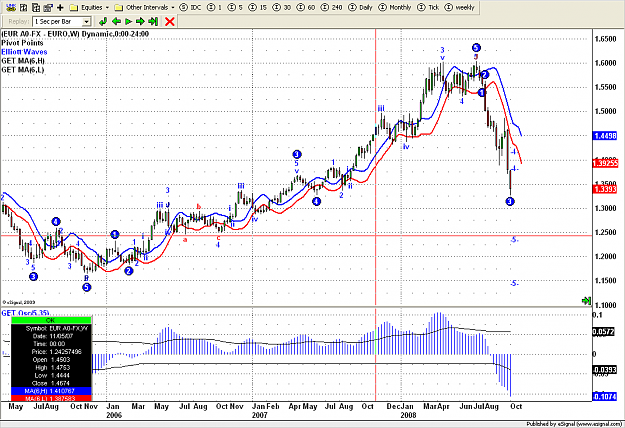
This is the weekly count for the Euro USD so far , It is what it is , If you have a different count your count is wrong .
Ignored
Thanks for posting your software chart tazzam. But the last wave-1 and wave-2 on your chart looks proportionally too small to wave-3-4-5 to me. I could be wrong but I'll wait and see.
Thanks for posting your software chart tazzam. But the last wave-1 and wave-2 on your chart looks proportionally too small to wave-3-4-5 to me. I could be wrong but I'll wait and see.
Ignored
yes i agree the wave count changed , old 2 to 5 now was actually wave 2 to 3 , when wave 4 did not hold to make a new higher wave 5 all wave count changed , I will post few weekly back test chart for you to look at .
Weekly Back test from 9/22/08 to 5/05/09
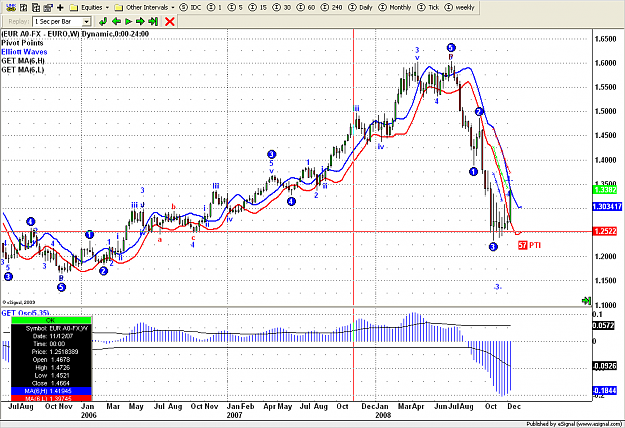
Also if you look at the PTI number on the first chart below the PTI was 28 , This is a very low PTI and shows weekness for the euro to make a new high at this time, PTI Have to be above 35 and can't break the red line (channel) , To qualify for type one trade elliot wave (4 to 5 wave) see for any pair to chart below.
Thanks for the charts tazzam. Suppose (just suppose) a few days later, price moves above the top of wave-5 on your chart, how would your software change the current wave-5 label?
Thanks for the chart and comment Saras. Do you also have your count on the weekly?
From 1992~2002 USDCAD also had a large degree 5-wave movement. I think that chart pattern has some similarities to today's weekly EURUSD chart. Just a thought.
Ignored
No sorry don't do such long time frame analysis it's not very useful
Sarasxxx quite good count. I had the same becouse of channeling. But currently 0-2 line is broken (check it), and second thing is size of 4 wave - its a lot bigger than 2nd wave. I think there is small possibility to make this 5th wave up, but imho its really small. Try to count it like the 5th wave is finished, and currently we are doing B wave in downtrend - complicated B. I think it's so complicated becouse its B (correction) in D (triangle) - correction.
Ignored
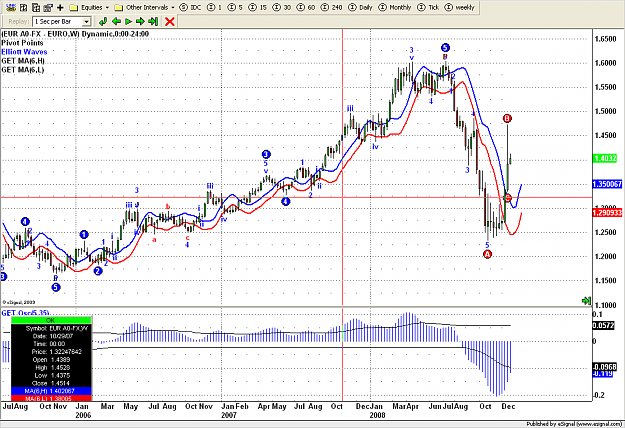
the 0-2 trendline can be broken when wave-4 unfolds and then it becomes the 2-4 trendline which will not be broken untill wave-5 completes and so far it hasn't. The 4th wave is really big compared with wave-2, but according to alternation between 2 and 4 and since wave-3 is very extended i think it's acceptable, and i don't think it;s going to be a triangle since now I have counted a start of a new impulse and the retracement is too big for that to be a zigzag so I'm tipping that there will be a failled wave-5; if i'm wrong and it is really triangle doesn't matter because i still will be going in the same direction as the triangle legs only with different count
No sorry don't do such long time frame analysis it's not very useful
Ignored
I used to think so. But I think differently now because the longer time frame chart, especially the weekly chart, presents the general trend of the market (provided the chart reading is correct). It also indicates which direction the price tends to fluctuate in the near term, which is helpful for day trading as well. Just my 2 cents.
I used to think so. But I think differently now because the longer time frame chart, especially the weekly chart, presents the general trend of the market (provided the chart reading is correct). It also indicates which direction the price tends to fluctuate in the near term, which is helpful for day trading as well. Just my 2 cents.
Ignored
tahts all good but i'm doing intra day trading so not much use for me
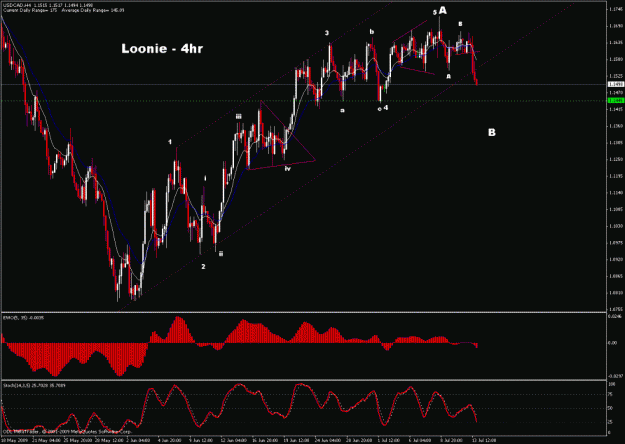
I am short from 4 days ago +ve pips now , I will post my daily and my 4H charts once I go back home, I use 150 pips trailling stops and Sl above the high , This is my second time in the last 7 days shorting this pair first one hit my SL .
I am short from 4 days ago +ve pips now , I will post my daily and my 4H charts once I go back home, I use 150 pips trailling stops and Sl above the high , This is my second time in the last 7 days shorting this pair first one hit my SL .
Ignored
Good for you tazzam. Hope you make more from this one
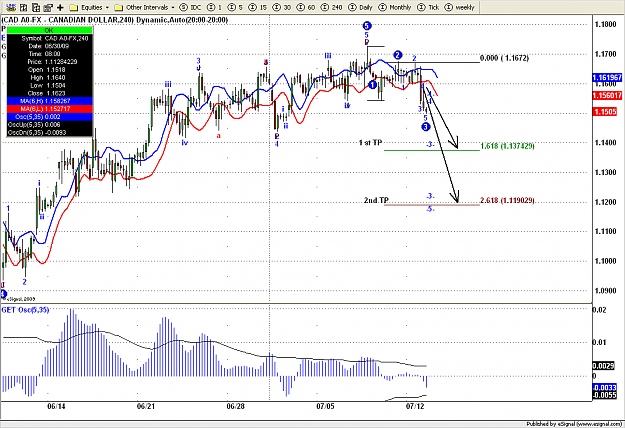
The Loonie looks to be correcting into the 1.1350 area (38.2% of move from 1.0780) to complete Wave B of a potential double zigzag that should end in the 1.2100 area.
The Loonie looks to be correcting into the 1.1350 area (38.2% of move from 1.0780) to complete Wave B of a potential double zigzag that should end in the 1.2100 area.