DislikedHi All
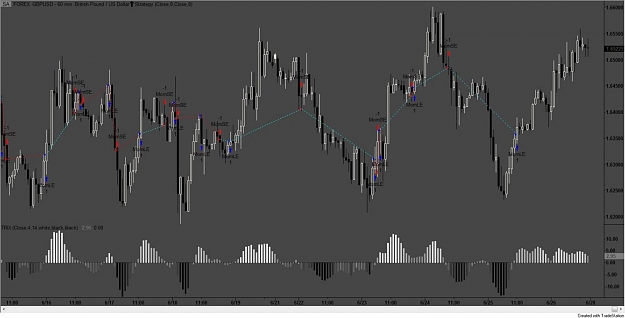
Just going on from my last post, here is the GU H1 chart for this week with my trades.
Please note that I only use Vorticity and that I wait for the close of the 3rd bar after colour change. This is vital as vorticity can repaint 2 previous bars in the worst case.
Depending on your timing getting to the PC, there was easily 600+ pips here for 6 trades. Total screen time, less than 10 minutes.
AnneIgnored
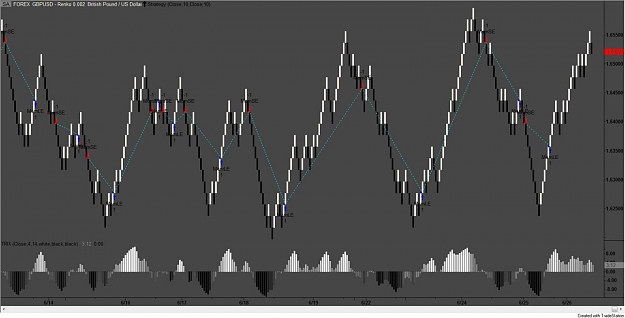
1. Waited for third dot to appear.
2. Saw the third dot appear.
3. Waited for the candle to close.
4. If and When the candle closed on the third dot I reversed my position.
I dont know if that was correct way to do it, but the way I did it I resulted in +425 for the week. Not bad however it trended really good. What happens in a choppy trend? The bank takes my money
Is this the correct way to calculate? It seems really hard to understand because my results are so different.
Thanks
Market Makers are the best