Hello Traders,
I stated this thread to help a good friend of mine so that he may use this strategy more effectively as well as allow the community to add to / benefit from what I call my Honey Bunches of Pips strategy. While this is NOT a 100% completely effortless system (like the myalchemyworks website) it is intended to allow traders the comfort of not being glued to their computers yet make some very nice manual trades. I.e. you to start looking only when an alert is given and ONLY TRADE when there is high probability of a nice movement to follow.
Those of you who would like to try this strategy out are welcome to post screen captures of their charts when they get a signal so that the community as a whole can help interpret what we are looking at, what to look out for etc... so that we can all make some money.
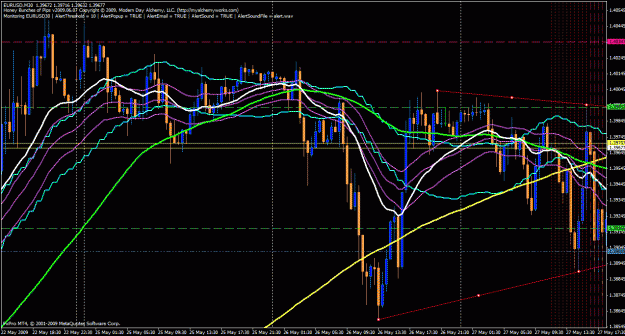
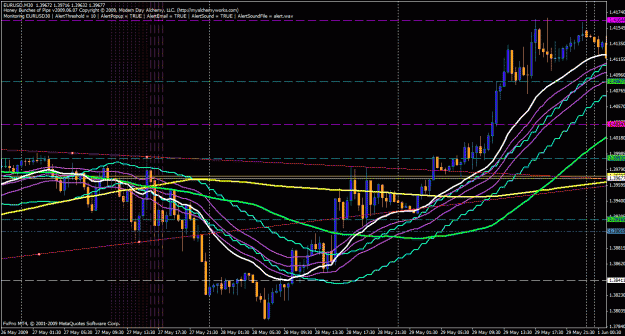
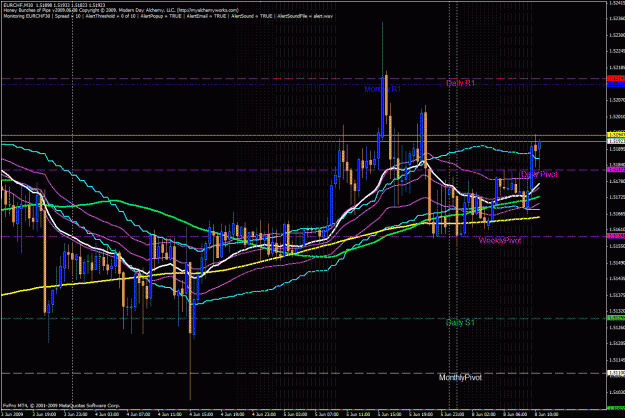
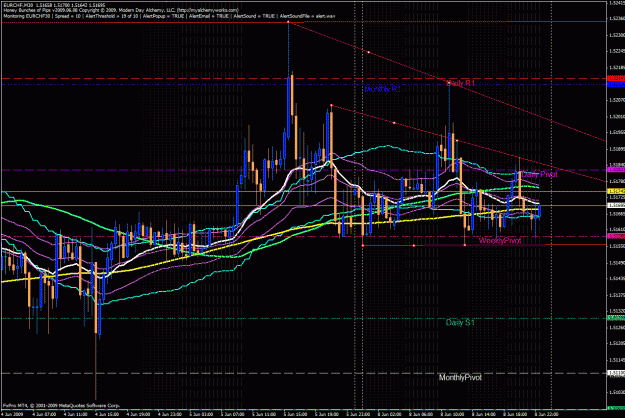
I have attached the Honey Bunches of Pips indicator along with a template so that you may follow along / join the discussion. While I usually use a few more indicators on my charts which help me see more clearly what the market is trying to tell me, I have also included the basic template because a trader MUST learn how to read the chart and candle patterns.
The strategy is simple. Set the indicator on a chart, turn on the notification and wait. I run this on multiple instruments and I usually use this on the M30 time frame but it works from M5 up to H4. Obviously the higher the time frame, the more pips one can expect from a signal once the market starts to break.
Once you get a notification then it's time to start looking at the charts.
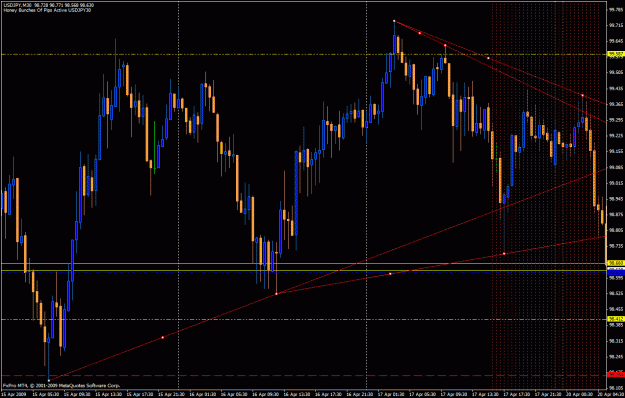
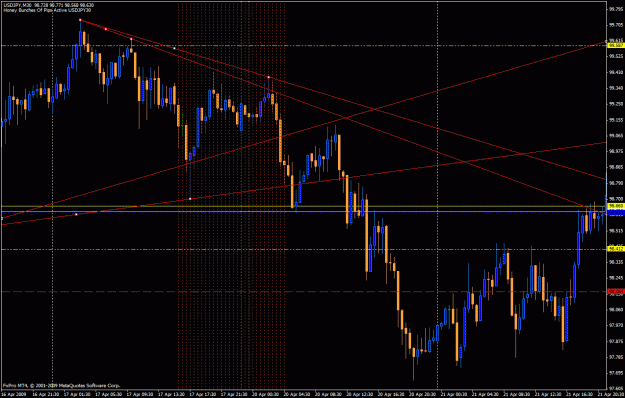
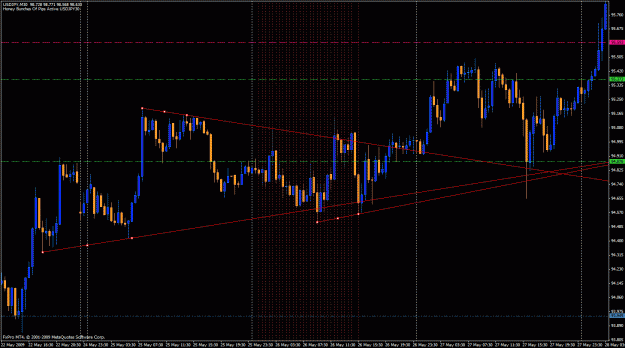
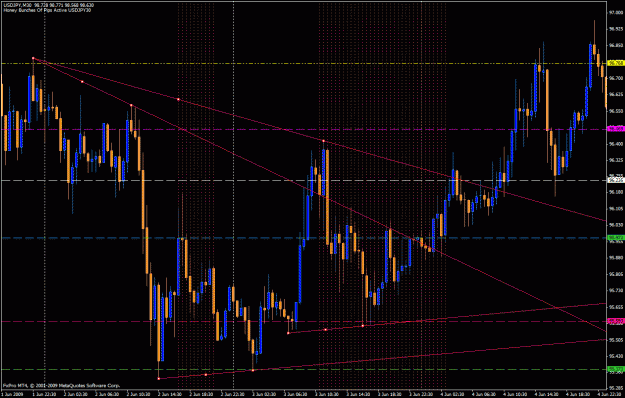
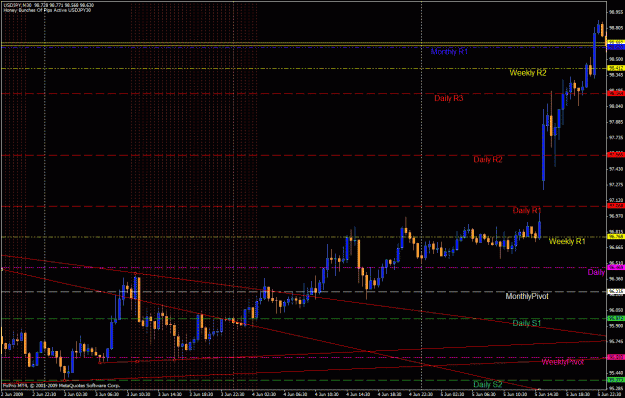
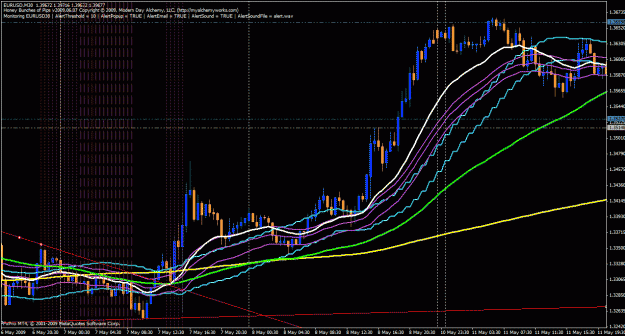
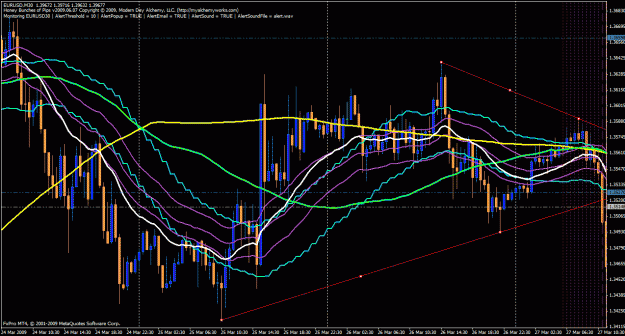
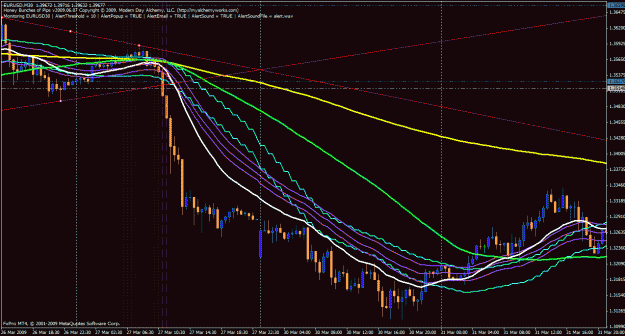
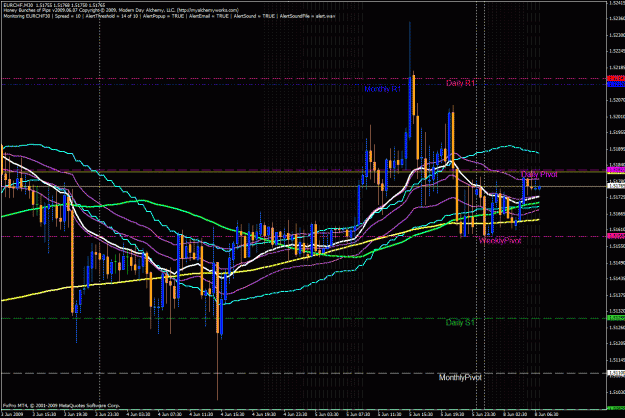
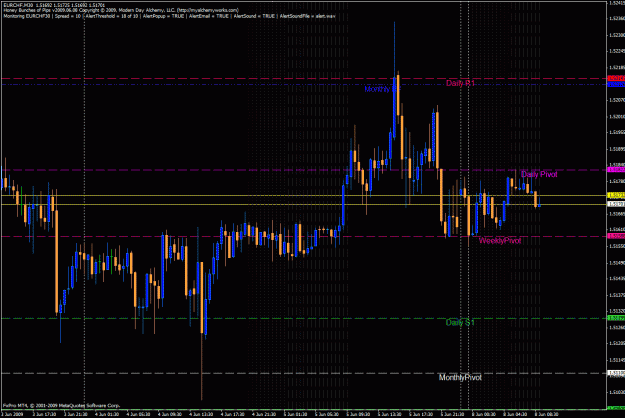
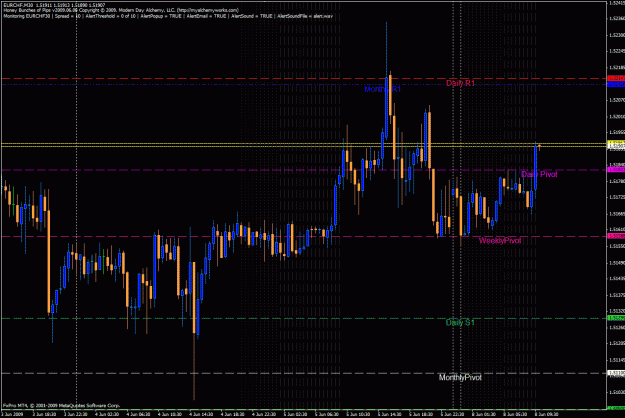
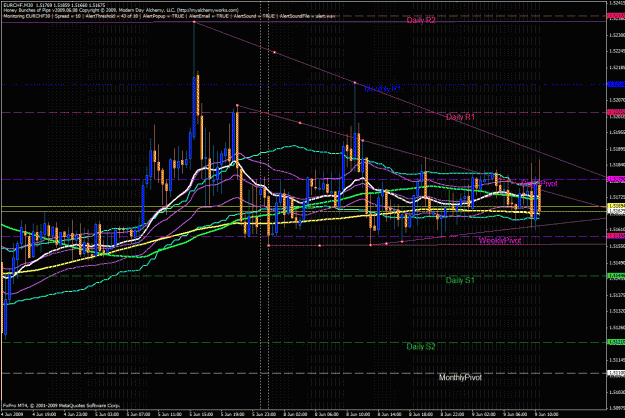
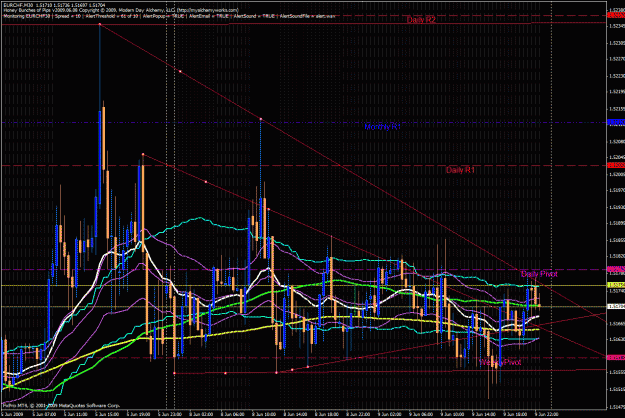
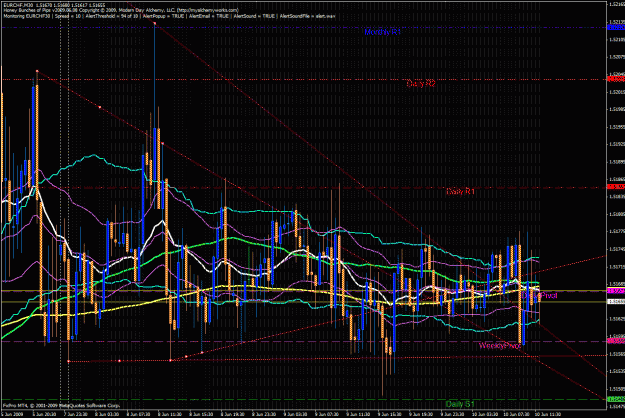
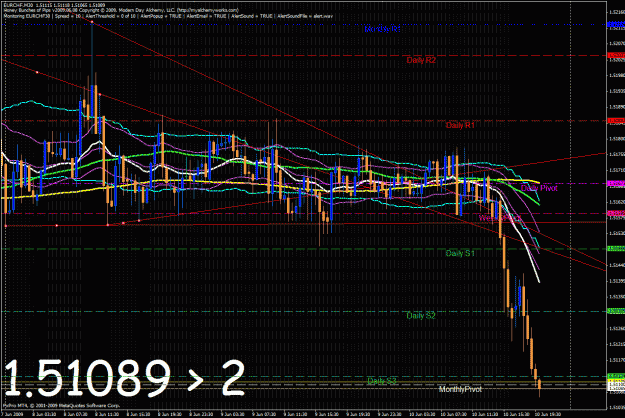
First step is to draw your support / resistance lines as you see them from past price action. Then we wait to see what price is wanting to do. Here is where learning to read a chart comes in very handy. Sometimes the direction will be clearly visible and sometimes we have to wait for the markets to make up their mind which way they want to move.
Unless the charts are showing me a really good pattern, I will normally wait until I no longer get a signal to think about entering the trade. This will give the markets plenty of time to show me where it is they really want to go.
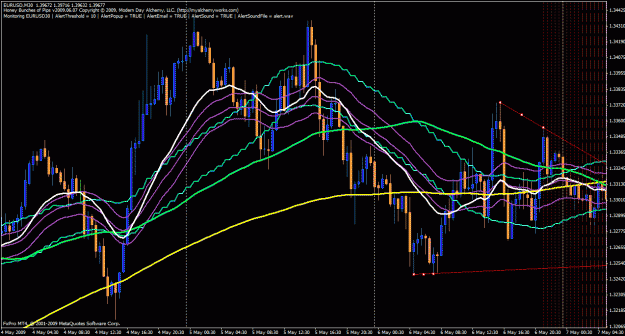
This strategy / system will come in very handy for for those technical traders who like to look at candle patterns and can recognize simple chart patterns (double top/bottom, higer/lower highs/lows, etc.)
The Indicator has an "AlertThreshold" parameter which I default to 10. Once 10 consecutive indicator lines are drawn an alert will be triggered.
Keep in mind that this system does not tell you how to trade, although I am hoping that the discussions from this posting will help those newbie traders out there. Some setups are obviously better than others and those really good setups will stand out very brightly.
As always, the market only gives an opportunity to make money, not a guarantee. It's up to the individual trader to look at the charts, manage risk accordingly, and of course make some money!
Also... any changes I make to the code will be found in this post. Please check the Last Edit time, and if you downloaded your indicator before this date, please download the new version.
I stated this thread to help a good friend of mine so that he may use this strategy more effectively as well as allow the community to add to / benefit from what I call my Honey Bunches of Pips strategy. While this is NOT a 100% completely effortless system (like the myalchemyworks website) it is intended to allow traders the comfort of not being glued to their computers yet make some very nice manual trades. I.e. you to start looking only when an alert is given and ONLY TRADE when there is high probability of a nice movement to follow.
Those of you who would like to try this strategy out are welcome to post screen captures of their charts when they get a signal so that the community as a whole can help interpret what we are looking at, what to look out for etc... so that we can all make some money.
I have attached the Honey Bunches of Pips indicator along with a template so that you may follow along / join the discussion. While I usually use a few more indicators on my charts which help me see more clearly what the market is trying to tell me, I have also included the basic template because a trader MUST learn how to read the chart and candle patterns.
The strategy is simple. Set the indicator on a chart, turn on the notification and wait. I run this on multiple instruments and I usually use this on the M30 time frame but it works from M5 up to H4. Obviously the higher the time frame, the more pips one can expect from a signal once the market starts to break.
Once you get a notification then it's time to start looking at the charts.
First step is to draw your support / resistance lines as you see them from past price action. Then we wait to see what price is wanting to do. Here is where learning to read a chart comes in very handy. Sometimes the direction will be clearly visible and sometimes we have to wait for the markets to make up their mind which way they want to move.
Unless the charts are showing me a really good pattern, I will normally wait until I no longer get a signal to think about entering the trade. This will give the markets plenty of time to show me where it is they really want to go.
This strategy / system will come in very handy for for those technical traders who like to look at candle patterns and can recognize simple chart patterns (double top/bottom, higer/lower highs/lows, etc.)
The Indicator has an "AlertThreshold" parameter which I default to 10. Once 10 consecutive indicator lines are drawn an alert will be triggered.
Keep in mind that this system does not tell you how to trade, although I am hoping that the discussions from this posting will help those newbie traders out there. Some setups are obviously better than others and those really good setups will stand out very brightly.
As always, the market only gives an opportunity to make money, not a guarantee. It's up to the individual trader to look at the charts, manage risk accordingly, and of course make some money!
Also... any changes I make to the code will be found in this post. Please check the Last Edit time, and if you downloaded your indicator before this date, please download the new version.
Attached File(s)