I personally wouldn’t just enter on ANY round number like I’ve seen suggested by someone. That just seems too risky since the pair could turn around at any time without warning.
I’ve observed something with EURUSD that might be unproven but seems to be holding up for most part. Yesterday I entered a long position on EURUSD using my observations. What I do at the beginning of each week after identifying my direction bias, is to look for key areas where price has seemed to form some kind of support or resistance (S/R) in the past year or so. If after drawing my fibs, I see they coincide with these areas I pay special attention to these areas for a retracement and entry. As price moves throughout the week I redraw my fibs to see if anything changes and whether the fibs move to a new area of price significance. As Jacko pointed out in his first post, the strongest fib area is 50%. That’s the only fib he uses and he likes that number especially when it coincides with S/R. He doesn’t really pay as much attention to the 23.6% and 38.2% fibs.
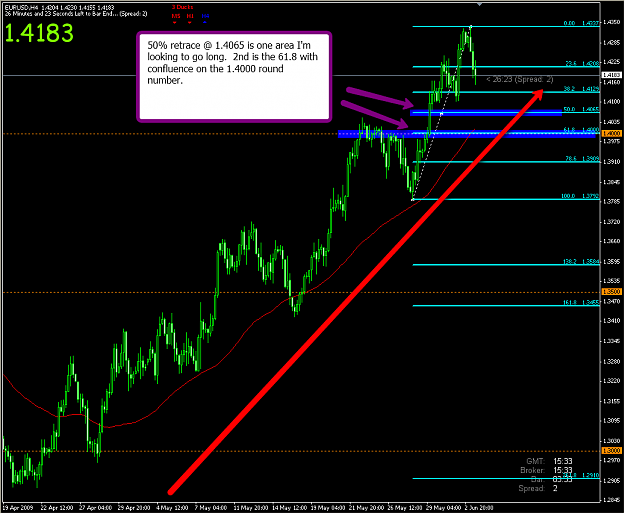
What I am noticing, and I should state I haven't followed this method for long, is the 23.6% and 38.2% fibs are holding up with this trend. The 38.2% seem to be more reliable than the 23.6%. Either way, they both need to coincide with some degree of S/R. I posted early in the week that the key area I was looking at was 1.4125 instead of the 1.4050 area most people were locked in on. 1.4125 formed the 23.6% fib at the start of the week. Recent history showed 1.4125 as an area where price either topped out, bottomed out, or had trouble getting past on either side. I then noticed price in this current trend kept going back to that level then bouncing northward. Yesterday when it did that for the 3rd or 4th time, I went long and it kept going for a profit. It just skyrocketed up unabated after going as low as 1.4103. I still entered late (at 1.4200). I would’ve entered at 1.4150 but was sleeping and didn’t set a pending order.
The 1.4125 area is now the 38.2% fib from the high of the current up trend. I am not thinking to automatically trade that area. Instead, I’ll be looking to see price how reacts if it gets to that area. I also wouldn’t put a trade on until price bounces northward from this area to about 1.4150. If it smashes through 1.4100 on its way down, I’ll then start looking at the 50% fib. Note, however, that I don’t see a confluence of S/R with the current 50% fib, which is somewhere around 1.4065. If it doesn’t get to either of those areas I’ll just wait for a better opportunity to re-enter.
While my observation seems promising, it does opens up the risk more than waiting for a 50% fib. It might be a better solution for early entry as opposed to just jumping in at any round number. I’m also seeing similar things on USDJPY as well.
I’ve observed something with EURUSD that might be unproven but seems to be holding up for most part. Yesterday I entered a long position on EURUSD using my observations. What I do at the beginning of each week after identifying my direction bias, is to look for key areas where price has seemed to form some kind of support or resistance (S/R) in the past year or so. If after drawing my fibs, I see they coincide with these areas I pay special attention to these areas for a retracement and entry. As price moves throughout the week I redraw my fibs to see if anything changes and whether the fibs move to a new area of price significance. As Jacko pointed out in his first post, the strongest fib area is 50%. That’s the only fib he uses and he likes that number especially when it coincides with S/R. He doesn’t really pay as much attention to the 23.6% and 38.2% fibs.
What I am noticing, and I should state I haven't followed this method for long, is the 23.6% and 38.2% fibs are holding up with this trend. The 38.2% seem to be more reliable than the 23.6%. Either way, they both need to coincide with some degree of S/R. I posted early in the week that the key area I was looking at was 1.4125 instead of the 1.4050 area most people were locked in on. 1.4125 formed the 23.6% fib at the start of the week. Recent history showed 1.4125 as an area where price either topped out, bottomed out, or had trouble getting past on either side. I then noticed price in this current trend kept going back to that level then bouncing northward. Yesterday when it did that for the 3rd or 4th time, I went long and it kept going for a profit. It just skyrocketed up unabated after going as low as 1.4103. I still entered late (at 1.4200). I would’ve entered at 1.4150 but was sleeping and didn’t set a pending order.
The 1.4125 area is now the 38.2% fib from the high of the current up trend. I am not thinking to automatically trade that area. Instead, I’ll be looking to see price how reacts if it gets to that area. I also wouldn’t put a trade on until price bounces northward from this area to about 1.4150. If it smashes through 1.4100 on its way down, I’ll then start looking at the 50% fib. Note, however, that I don’t see a confluence of S/R with the current 50% fib, which is somewhere around 1.4065. If it doesn’t get to either of those areas I’ll just wait for a better opportunity to re-enter.
While my observation seems promising, it does opens up the risk more than waiting for a 50% fib. It might be a better solution for early entry as opposed to just jumping in at any round number. I’m also seeing similar things on USDJPY as well.