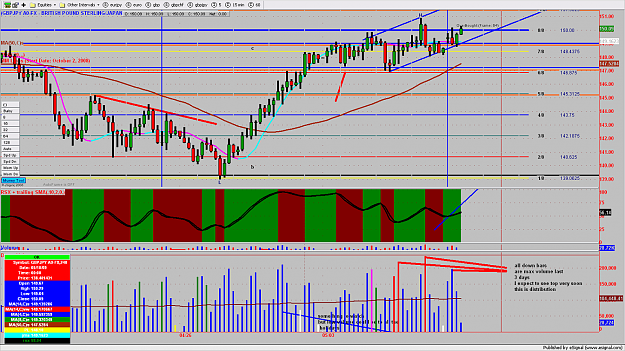
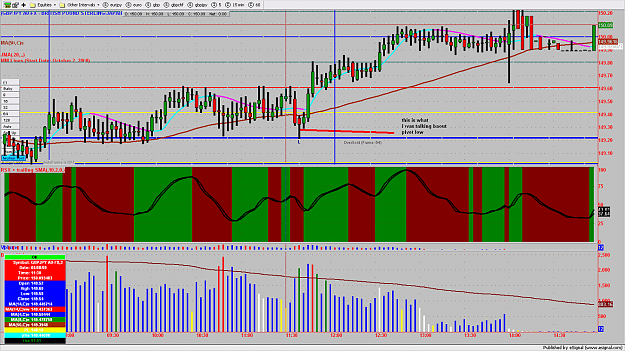
DislikedPits, here is your yearly fibs, we tested 150 the second time, and it is gearing up to break it once and for all.
and that will put 162.70 into focus later, prolly this month or june.
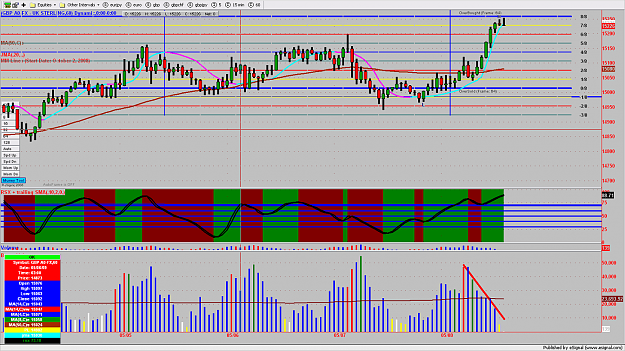
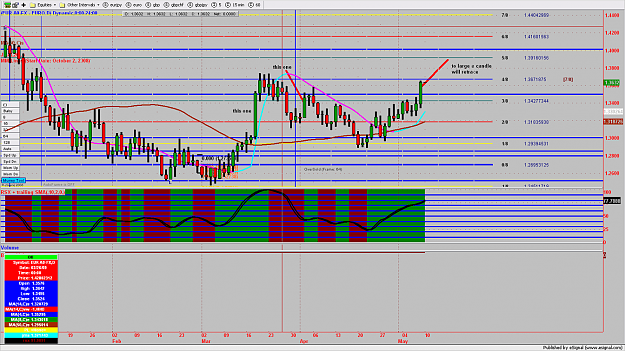
the second chart is daily and shows sustained buying pressure for now. unless daily turns, i do not see any downtrend forming.
again as i quoted earlier, we are doing sustained trading above last week high, which means dips are being bought, making shorting hazardous.
whats your stake on this.Ignored
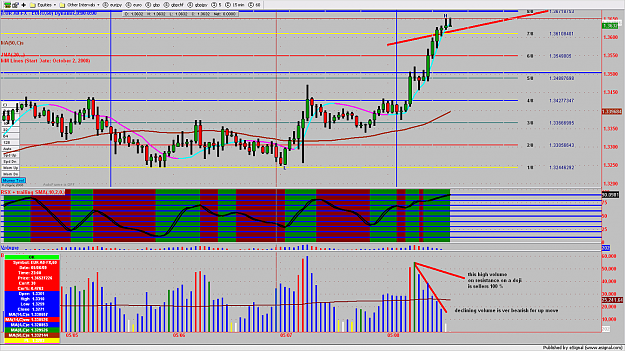
Dislikedthere goes my H4, now i am all in for longs
118, 120.xx.130.xx, and soon 140.xx levels will be history.Ignored
next week, if we break this level of 150.16 and do sustained trading above it, then it will be time to say goodbye to everything below this level permanently, or unless there is something on daily chart trend to change this view.
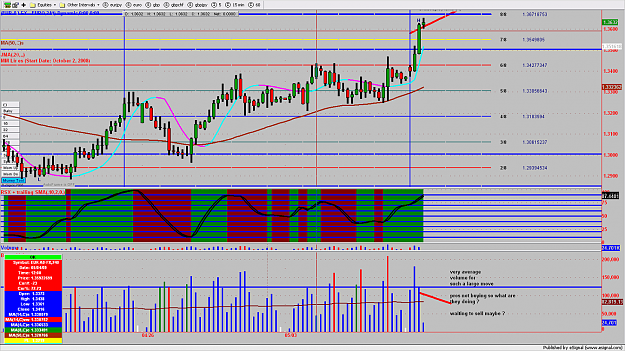
i don't give a shit to volume, but then T3MA automatically caters for it, that is why it works the way it does
Attached Image(s) (click to enlarge)