Hi all,
Glad this thread seems to be of use to some people!
With regards to hindsight trades - if you pay close attention to example 3, 4 and 5, they were taken from LIVE TRADE screenshots!
pic 3 was the point where I would have entered the trade. Pic 4 was confirmation, and pic 5 was where I would have exited. My stop loss would have been 5-10 pips below the last candle showing of the graph. The final pic shows that there was 10-15 pip profit on that particular trade.
You are absolutely right that a double top COULD have formed, but this are SHORT TERMS trades. If the price had gone the wrong way, then I would have been out very early.
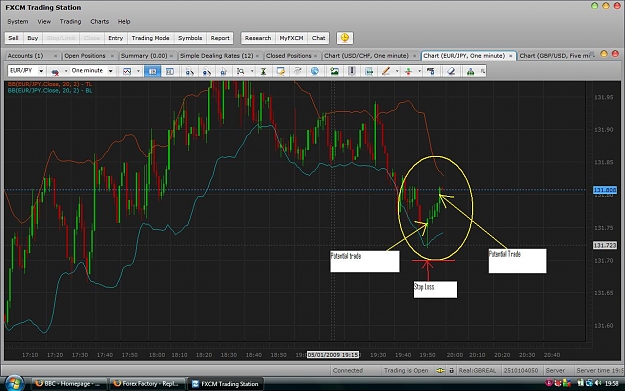
I chose that candle because it was a doji on a bollinger band (and I have seen this turn into a reversal quite a few times).
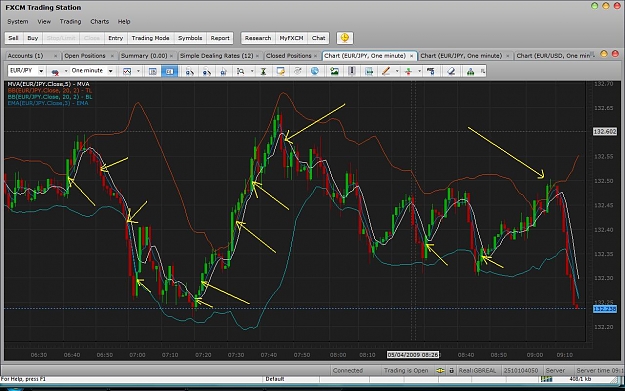
Again, like any system this is not perfect, but just by scanning a chart you can see where to expect the moves.
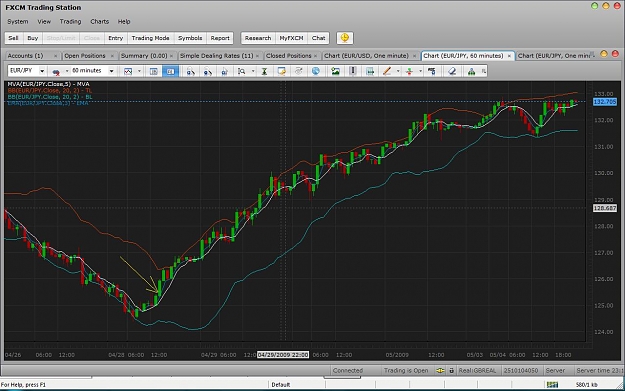
I've added another chart to show potential trades as they happened, and also indicating the stop loss
As for a template, not sure I can give a template with no indicators!!!!
The bollinger band is the standard default (it is there as a guide - NOT ESSENTIAL)!
The only way I can suggest to test this method is simply open ANY chart on a 1min (so you can see this happen in a short timeframe) and using just the default bollinger band, spot a turn occur - trust me they ARE obvious? If they aren't obvious they aren't trades!!
Hope this helps
Glad this thread seems to be of use to some people!
With regards to hindsight trades - if you pay close attention to example 3, 4 and 5, they were taken from LIVE TRADE screenshots!
pic 3 was the point where I would have entered the trade. Pic 4 was confirmation, and pic 5 was where I would have exited. My stop loss would have been 5-10 pips below the last candle showing of the graph. The final pic shows that there was 10-15 pip profit on that particular trade.
You are absolutely right that a double top COULD have formed, but this are SHORT TERMS trades. If the price had gone the wrong way, then I would have been out very early.
I chose that candle because it was a doji on a bollinger band (and I have seen this turn into a reversal quite a few times).
Again, like any system this is not perfect, but just by scanning a chart you can see where to expect the moves.
I've added another chart to show potential trades as they happened, and also indicating the stop loss
As for a template, not sure I can give a template with no indicators!!!!
The bollinger band is the standard default (it is there as a guide - NOT ESSENTIAL)!
The only way I can suggest to test this method is simply open ANY chart on a 1min (so you can see this happen in a short timeframe) and using just the default bollinger band, spot a turn occur - trust me they ARE obvious? If they aren't obvious they aren't trades!!
Hope this helps
Attached Image (click to enlarge)