The volume indie with the QQE on it,the purple and red one.
Thankyou again.
Ignored
sorry for being late , I got some where in this forum , I have no more information about but it coincides with increase with accumulation/distribution & sudden drop or less the break .
purple & red ones volume indicator ? it is inbuilt in MT4 .
and QQE perhaps all know , specially cross 50 in any tf pa mostly follow the direction to.
now, lets take ur chart.....lets look at the first highlighted portion...price has broken thru resistance...u think thats wonderful and u r itching to go long...but wait....the candle that broke thru the resistance was not a big one....the resistance has been strong so far and so if it has to be broken, u need lot of buyers to push the the price and so u expect a very long candle...but what u have is a small one...so lets wait and watch for other stuff...it is an area of previous resistance....i.e. not only is it a resistance cos MM level is there,...
hi every 1...my gu chart lukz lk goin test waveC...
Ignored
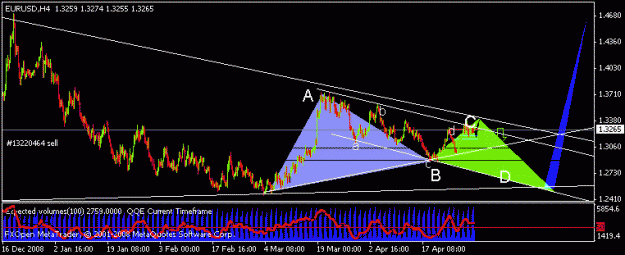
Thanks or the information & chart.How do u count ,butterfly or gartley ? anyway they are bullish in nature .small one perhaps near c & then down to d below 2/8MM and bigger one also seems bullish yet to form D , below 1/8MM for the UP movement. so they seems short term bearish.
fontu
Not understand?better not follow my analyses!doubt clearer first, risks ++
Joined Mar 2008
|
Status: Name real with real own way
|20,610 Posts
This week should most cretical when price poses to break the daily/weekly upper trendline and after bull stampede thoughout last week & still posing very strongly.
Just trying to have an idea how this week may react.
In my pair of refernce eurusd though strong bullish signs are of great concern yet it should not not as easy as thought.Without considering the GAP on either direction , price go either 1.3339 or down 1.3188 to 1.3150 , the later is most probable price.but if continue up & reach 1.3339 it again to retrace to 1.3188-1.3150 ( likely).
next a bull to run till the UTL daily at about 1.3409,now the as it reach the great border of the great bull likely not go direct UP though every pair posing so high up & not know fundamentals behind this to support . Most likely it should have a good retracement before such bulls .
I draw a bullish gartley ( not exactly how should be ) it to form D at about 1.2573 to 1.2492 , if so happen then there will great short opportunity most of the week.
In another chart 15M tf it seems the price up first to at least to 4/8MM in H1 or 1.3328 double top at the top of the down channel to have the good retracement to start.
Whatever most important price should be expect at 1.3339, 1.3188,1.3150 ,1.3409 and last down ......1.2573 .
fontu
Attached Image(s) (click to enlarge)
Not understand?better not follow my analyses!doubt clearer first, risks ++
This week should most cretical when price poses to break the daily/weekly upper trendline and after bull stampede thoughout last week & still posing very strongly.
Just trying to have an idea how this week may react.
In my pair of refernce eurusd though strong bullish signs are of great concern yet it should not not as easy as thought.Without considering the GAP on either direction , price go either 1.3339 or down 1.3188 to 1.3150 , the later is most probable price.but if continue up & reach 1.3339 it again to retrace to 1.3188-1.3150 ( likely)....
Ignored
Fontu,
We all are pleased by your performance and concern for everyone and are driven to have those succeed. You are a great asset to this thread.
Please keep us posted for the future.
?::::
I have downloaded the expected volume indicator from another post. However I do not show the red line. what have I done wrong? Can you post the indicator fro us to share when you have chance?
Thank you in advance
JP
Han
Ignored
Thanks , red line? it is QQE but the colour have changed to red only.
Thanks ,
fontu
Not understand?better not follow my analyses!doubt clearer first, risks ++
Been following this thread for quite a while and trying to absorb as much as I can! Kudos to Karthik and Fontu, keep up the good work. Will contribute in whatever way I can! BTW, love the Sneha pics!
I see in eu 1.3339 was taken up & now I will see if it hit 1.3188-50 before the hit daily/weekly UTL at about 1.3409.
fontu
Ignored
fontu,
thanks for all ur contributions to this thread so far....as mentioned, i would like this thread to be a storehouse of important information rather than saying crap messages like '155 here we come or 130 here we come' for every 100 pip move....i also dont want people to traverse 50 pages to get some basic info....so thanks for all ur contributions so far and keep ur analysis flowing...
Thanks or the information & chart.How do u count ,butterfly or gartley ? anyway they are bullish in nature .small one perhaps near c & then down to d below 2/8MM and bigger one also seems bullish yet to form D , below 1/8MM for the UP movement. so they seems short term bearish.
fontu
Ignored
m using search patterns indi bro....yea short term bearish after done wave c start bullish...
fontu,
thanks for all ur contributions to this thread so far....as mentioned, i would like this thread to be a storehouse of important information rather than saying crap messages like '155 here we come or 130 here we come' for every 100 pip move....i also dont want people to traverse 50 pages to get some basic info....so thanks for all ur contributions so far and keep ur analysis flowing...
Ignored
Its ok Boss , the owner of this interactive( ? private ) thread but afterall it is all about price action and doing & learning any some numbers must come ,they were not call for people to trade . I hope you should request FF people transfer this to other places to keep it real silent.
Sorry for any noise .
fontu
Not understand?better not follow my analyses!doubt clearer first, risks ++