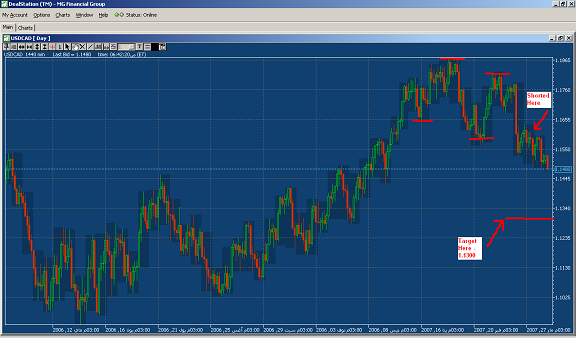
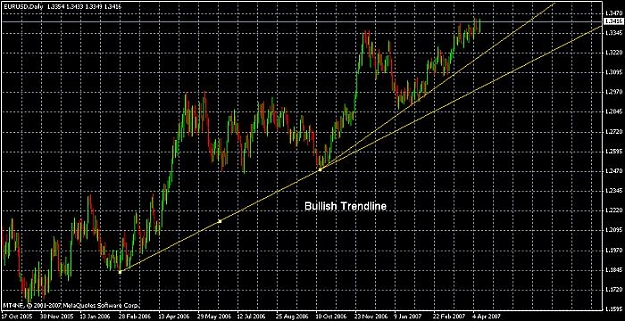
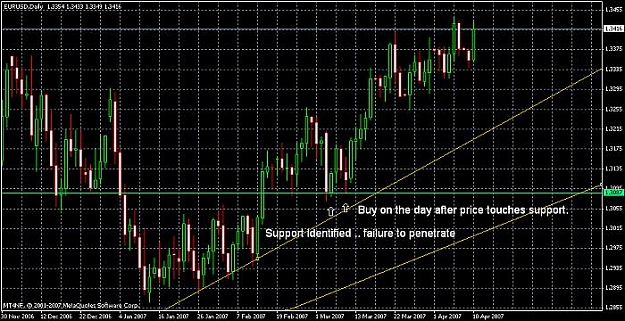
I've recently started drawing horizontal lines on zoomed out charts looking for support and resistance. Looking for old support becoming new resistance and vice versa. Also thinking of S/R as zones rather than finite points. I'm finding it very helpful.