There you will find the pure VSA Schematics : accumulation - markup - distribution - markdown.
I've just considering, if there is any possibility to code 'VSA cycles indicator" in MT4, that will enable us to "read the market" in VSA cycles Style for short - long term trade Setup.
i have problems with forecasting a break or a bounce at support or resistance. Some are saying, if you have low volume, then it will be most likely a bounce. If we have high volume it will be a break. Is that all? I mean we could have a upthrust with high volume, which will be a sign for a bounce.
What do you say? How do you enter breaks? Do you enter breaks at all, in advance or only later?
Thanks for all your help.
look at gu 4 hour today ... we had a really high volume low spread bar at top ... could be end of rising market as it is at area of previous resistance.
Ignored
Hi Malcolmb
I think a lot of this volume had to do with the EUR news release and subsequent trading in the EURUSD and EURGBP pairs.
If you have a look at the GBPUSD on a lower timeframe for about and hour to two after the news release you will see how volatile it gets. I dont think the volatility but its non directional (Selling of the USD and Selling of GBP, so GBP whips up and down) was caused by direct trading in this pair.
Hi Traders,
i have problems with forecasting a break or a bounce at support or resistance. Some are saying, if you have low volume, then it will be most likely a bounce. If we have high volume it will be a break. Is that all? I mean we could have a upthrust with high volume, which will be a sign for a bounce.
What do you say? How do you enter breaks? Do you enter breaks at all, in advance or only later?
Thanks for all your help.
Ignored
In the following chart you see a breakout of 1.4700. Good forecast was here that the candle closed above the resistance and, even more important, at the top of candle. Thanks to islander to this explanation. It really sounds obvious. Could come from me. lol
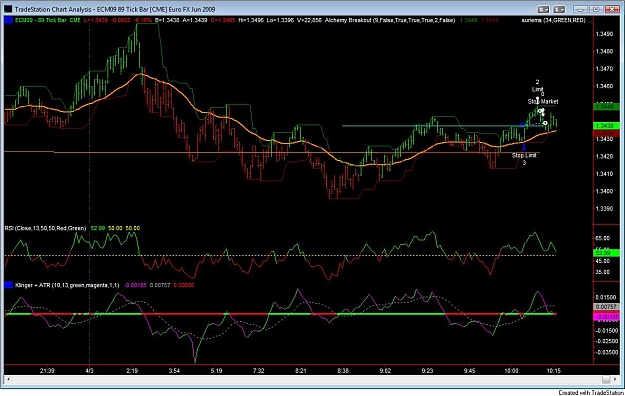
RobBroker - further to your chat comment just now, this is the thinking behind the Klinger indicator that I am using : I find it easier to read than volume bars (I have experimented pretty intensely with various representations of volume over the last month).
Published by Stephen Klinger: (TS does have a Volume Oscillator in its library.) The Dec 1997 issue of Tech Analysis of Stocks and Commodities published the Klinger Oscillator in the December Traders’ Tips. This is the cut and paste explanation: In "Identifying trends with volume analysis" in this issue, Stephen Klinger gives a new approach for using volume. The TradeStation Traders' Tip this month is based on the volume oscillator (KVO) presented in the article. For TradeStation and SuperCharts, we'll call the indicator Volume Osc (not the one that we have in the TS library). This indicator can plot both the short-term and long-term versions of the oscillator. The indicator uses a total of four inputs: FastX determines the length of the faster (shorter) exponential moving average of the volume force; SlowX determines the length of the slower (longer) exponential moving average of the volume force; Trigger determines the length of the exponential moving average used to smooth the KVO line; and Smooth determines the amount of smoothing of the KVO and trigger lines using a summation of the values. The Smooth input allows for the generation of smoothed plot lines for longer-term analysis. If the Smooth input is set to 1 or zero, no smoothing will be in effect. The process of developing this indicator begins with the creation of two functions, Vforce and KVO. These two functions basically provide supporting calculations, which will allow the oscillator values to be easily referenced from other custom studies. The two functions should be created in the order presented below, using their assigned names.
The Klinger Oscillator is a construct which is intended to illustrate when price changes are confirmed by volume. The price is expected to follow the Klinger Oscillator if there is a divergence between the price and the indicator. The Klinger Oscillator computation involves constructing a parameter called the 'Volume Force' which combines close, high, low, and volume into a single indicator. The Klinger Oscillator is then created as a fast exponential moving average of the Volume Force minus a slow exponential moving average of the Volume Force. The KO takes two input parameters: the periods for the fast and slow moving averages, respectively.
In addition to the above, the TradeStation user who coded this indicator modified it as follows :
I added summation and ATR to the Klinger indicator. Allows for more "visual amplitude" and it leads faster than the regular Klinger. Notice that it crosses the midline sooner. I also have the midline colored for quick visualization of upward or downward trend.
from the background we know it's bullish. however we can see there's a stopping volume. followed by no demand (1 & 2). what's the significance of the next 2 bars?
from the background we know it's bullish. however we can see there's a stopping volume. followed by no demand (1 & 2). what's the significance of the next 2 bars?
Ignored
Hi hwsv
The problem with 4 Hours charts and the nature of the forex market where you have different trading sessions coming online during a 24 hour cycle makes trying to read them using VSA principles quite difficult. I think the 4 hour timeframe is the one timeframe that should be avoided for this purpose. If you have a look at the volume pattern on the chart you posted you will see a clear pattern as the active markets come on and offline again.
I would either drop down to an hourly timeframe or go up to a daily.
from the background we know it's bullish. however we can see there's a stopping volume. followed by no demand (1 & 2). what's the significance of the next 2 bars?
Ignored
~~~~~~~~~~~~~~~~~~~~~~~~~~~~~~~~~~~~~~~~
Hi~
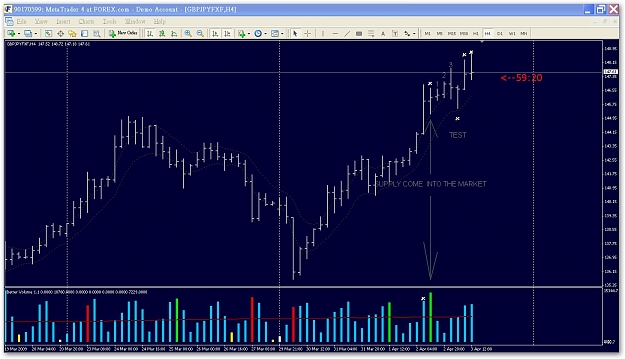
you can see this a price level is a higher than left.
and the bar before "1" bar is an up bar but with heavy vol.it is a kind of weakness signal.
it doesn't mean price would reversal sharply,after all the trend is up.but it could mean the sm start transfer their position to the herd.
3 is an up-thrust and next bar is a test.
the test bar's vol is not high ,sm don't decide to the downside yet.
it means price would go up .but there are several weakness signals in left.price may not go far.
~~~~~~~~~~~~~~~~~~~~~~~~~~~~~~~~~~~~~~~~
Hi~
you can see this a price level is a higher than left.
and the bar before "1" bar is an up bar but with heavy vol.it is a kind of weakness signal.
it doesn't mean price would reversal sharply,after all the trend is up.but it could mean the sm start transfer their position to the herd.
3 is an up-thrust and next bar is a test.
the test bar's vol is not high ,sm don't decide to the downside yet.
it means price would go up .but there are several weakness signals in left.price may not go far.
i still learn...
Ignored
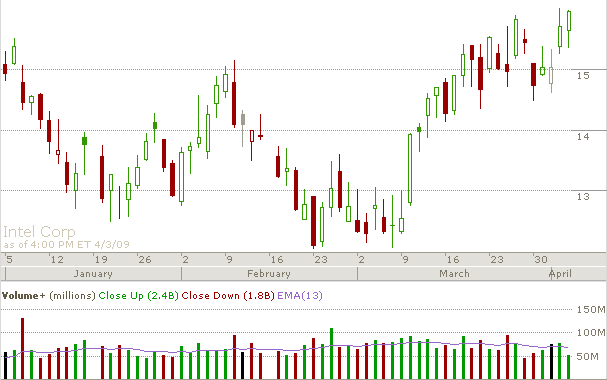
In regards to VSA, I think you've done a fine job, I've also re-read tom williams books over again and I found out a couple of ways to make improvements on my traading also. I've began to take price history and compose a spread sheet which shows the average volume over a 30day period and the average spread over a 30 day period. Malcolm was exactly correct and I've learned to expand my view of VSA. I've been trading INTC for the past couple of sessions. What can be useful in retrospect to forex is to create a spreadsheet for 30 days which contains the pricing info/volume/spread of the particular pair your trading. You can utilize that data to give you a scope into the past to find out if the relative volume that the pair is trading at it either below average/average or above average. Also you can create an average for the spread also. Which will give you insight if the particular spread for the pair is average or above average etc.You can use that info to help you decide to enter into a pair on a daily basis.
could u explain in detail how u would determine a successful test?
high vol?
Ignored
Nope.... definitely not high volume !
The "Test"
A test is when the specialists mark the price down suddenly but the bar closes on, or near its high.
Successful tests are usually on low volume and, because of this low volume, generally signal that selling has disappeared. That's why the specialists (Smart Money) mark the price down suddenly, to "test" if there are any willing sellers. No sellers present means that the Market can rise without resistance.
But caution must be adhered to, as many tests can, and do, fail.
could u explain in detail how u would determine a successful test?
high vol?
Ignored
adding to what Willowgal has said, you must make sure that this area was tested on high to very high volume because otherwise it'll be considered as a shake out, now when previous high volume area is being tested on low volume the market should rise within the next 2-3 bars, if it doesnt, then it'll be further weakness, if that case happen around a support, i personally wait for a no demand bars to reshort it.
I recommend you read something else as this sentence is now concluded.
adding to what Willowgal has said, you must make sure that this area was tested on high to very high volume because otherwise it'll be considered as a shake out, now when previous high volume area is being tested on low volume the market should rise within the next 2-3 bars, if it doesnt, then it'll be further weakness, if that case happen around a support, i personally wait for a no demand bars to reshort it.
Ignored
I think I am confused now as this is what I have noted as a shake-out is
"A shake-out is a sharp downward move but then quickly reversing to close at or near the high (i.e. about where it started) and is always on high volume. A weak holder is a trader who has got himself into a bad trading position. He will be under stress because he can't really afford to lose if the Market turns against him. So he will panic and be "shaken-out" of what could have been a good position."
hi~
in that pic the bar before "1" bar you can consider it is a test also.but look at the vol.it is really high.
test with a high vol means supply is in the market.
price usually would re-test that area soon or later.
the second test is a successful test with low vol and next candle up with increasing vol immediately .it is bullish.
But there are several weakness signal in the background.
if i enter long position with that successful test.i would be very caution watching if price shows more weakness signal later.
I think I am confused now as this is what I have noted as a shake-out is
"A shake-out is a sharp downward move but then quickly reversing to close at or near the high (i.e. about where it started) and is always on high volume.
I understood a 'test' is usually on low volume.
Can anyone please clarify ?
Ignored
WG,
you're right (I think Obaidah didn't mean to say that and made some confusion with words maybe);
A shake-out is seen in bottoms before reversing - it's the equivalent to the upthrust in tops, so it's also called a reversed upthrust - and it comes with high volume.
The "ideal sequence" (ideal, because it can change sequence and shapes a bit) is:
on tops:
1 - hidden potential selling (buying climax; very high spread and very high volume, closing near but ideally not at the high, with a rising market behind it);
2 - end of a rising market (narrow spread and high volume, near or into a new high area)
3 - no demand (up bar with narrow spread and narrow volume)
4 - upthrust (fast moving into highs, but closing near its lows, generally with high volume).
On bottoms:
1 - hidden potential buying (selling climax; very high spread and very high volume, closing near but ideally not at the lows, with a falling market behing it);
2 - testing (down bar with narrow spread and low volume);
3 - no supply (similar to previous, but with very low volume, and closing above the middle);
4 - shake-out (fast moving into lows, but closing near its highs, generally with high volume).