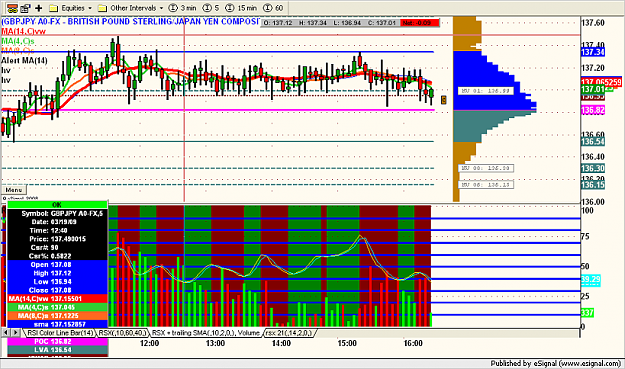
Dislikedtake note of grey lines in chart
they are high volume areas of up to 8 days ago H08 = high volume area of session 8 days ago ...etc etc
these are the battle lines and areas where buyers and sellers are hanging out. I have given up on fibs and most moving averages ... instead i am using the high volume areas for support resistance ....Ignored
Ha, ha, Nice try slipping that coding proposition in. I'm enjoying a sabattical from coding. But seriously though, since the volume on metatrader is tick volume (volume per unit of time)[ explanation for others)]and not contract volume (total volume at a particular price), I'm not sure it would reflect the high contract volume areas.