in the weekly candle chart USD LFX , now i can see 2 formations:
1-bullish doji star pattern
2- defective bullish tri star pattern
but for bullish doji star a window in between long black opening Bozu and Hoshi give us high value for this analysis also on the other part, long lower wick of black opening Bozu show us sellers were not abled to hold prices down. then after tug of war we can see a confirmation .
but about defective bullish tri star , that is where the shoe pinches open prices and close pirces are not same . but this is enough for us that we can see bearish power was dominishing .we must pay attentionwithin a period of 3 weeks real bodies are very small and then we see a confirmation for this pattern.
i see 1.97xx for USD LFX in the next time
let see
in the weekly candle chart EUR LFX , we have seen a bearish advance block pattern previous weeks. on this score ,this is important for our analysis . this is an alignment of sellers for an attack.
never mind !
yes never mind to this white of Bozu . in fact this is plough the sand by buyers. that does not follow for trouble brave's sellers .
no matter this bullish harami pattern for me because this is a false bullish harami pattern .
i look at the white of Bozu , but what see :
1-no tweezers bottom ( incompatible with previous candle for spinning)
2-small real body ( low power of buyers )
3-very small upper wick ( low courage buyers by reason seed of doubt has been placed in the bulls minds)
it is probable please God we will see 2.48xx in the next time for EUR LFX.
in a word easy money
also if we look in weekly candle chart EUR LFX ,we can see a double tops as a confirmation . of course this is a chart pattern . in the main if right of top have a false breakout , this is very good for honesty and high of value this double top.
Salam Hussin
i see you are going strong,nice to see you back
god bless
baz
Ignored
well done !
oh my God ! baz my dear bro and a bosom friend.
how do you feel ?
hey men , at least you can inform about conditions yourself to me by yahoo messenger or E-mail.
baz , also Rob come back . im filled with joy for see you back.
i think our group is perfect in this time.
im waiting for your posts
i wish you and your honourable family happiness
best regards
hussin
in the weekly candle chart EURUSD , we can easily see a bearish advance block pattern with medium reliability .
it results from the above posts(weekly EUR LFX & USD LFX ) , the LFX market show us 1.25xx for EURUSD in the next time.
in other word , a retest in 1.25xx
at first hand , it is a pity ! that we take no notice to bearish on neck pattern.a bearish continuation pattern
in sooth this pattern is nice .
but about weekly candle chart GBP LFX now we can see a bearish petrifying harami pattern .
anytime a long wick appear in a candlestick , traders should pay attention .
by nature with a scoop this pattern was a bearish Kabuse pattern . long lower wick of candle say us . but then buyers have defend from realm themselves. appearance long lower wick of candle say us. then bearish Kabuse pattern has changed to petrifying pattern .
in the weekly candle chart GBPUSD ,we see a bearish Kabuse pattern.even before a Kabuse formation , this pattern was a bearish engulfing pattern . but exit sellers and enter new buyers have changed bearish engulfing pattern to bearish Kabuse pattern .the assocation of candlesticks zone is important in this candlestick analysis .
also GBP LFX show us 1.40xx in the next time .
only i dont know , what is this Tohbo doing in this place ??
Joined Nov 2007
|
Status: left CanaryWharf desk-tea break
|23,547 Posts
Hi Hussin I was wondering my weekly is a Harami though I notice my MT4 did not open before price had dropped some ,so I’m unsure if the gap is real. Do you ever alter data in within the MT4 from a more reliable source to make sure it’s accurate? Also though I noticed this pattern I was thinking it may not be a strong one due to being at the bottom (for the min) of the trend. I can guess you would say in combination with the other analysis of the LFX etc we can add weight to the pattern. Thanks in advance Tony
in the weekly candle chart GBPUSD ,we see a bearish Kabuse pattern.even before a Kabuse formation , this pattern was a bearish engulfing pattern . but exit sellers and enter new buyers have changed bearish engulfing pattern to bearish Kabuse pattern .the assocation of candlesticks zone is important in this candlestick analysis .
also GBP LFX show us 1.40xx in the next time .
only i dont know , what is this Tohbo doing in this place ??
Hi Hussin I was wondering my weekly is a Harami though I notice my MT4 did not open before price had dropped some ,so I’m unsure if the gap is real. Do you ever alter data in within the MT4 from a more reliable source to make sure it’s accurate? Also though I noticed this pattern I was thinking it may not be a strong one due to being at the bottom (for the min) of the trend.
[font=Calibri][size=3]I can guess you would say in combination with...
Ignored
hi Tony
i don't know why is your weekly candle chart GBPUSD a bearish Harami pattern but my weekly candle chart GBPUSD is a bearish Kabuse pattern . i think maybe by reason your broker's mistake or without fail by other reasons .
in the main , i am not clear about that and also that's no news to me .
but Tony a recommendation for you , i dare say that MT4 under Java is very good and exact for presenting charts then other MT4 .
the charts of MT4 under Java are invaluable for candlestick analysis and also channels and trend lines then other MT4 .
as far as i know some of the brokers are presenting of information(charts) to the clients themselves by MT4 under Java ,as Oanda , CMC market , FXCM ,....
and also some other of the brokers are presenting of information (charts) to the clients themselves by MT4 , as MIG , FIBO , intb , ...
let us now turn to your question " Do you ever alter data in within the MT4 from a more reliable source to make sure it’s accurate? " no . but sometimes use from other charts( other brokers) for remove all doubt.
but about " I can guess you would say in combination with the other analysis of the LFX etc we can add weight to the pattern. "
certainly , but Tony this is very important that you be successful in theFX market . for success you must get ahead from other traders by time . the LFX show you signals fast . therefore you will be forward then other thraders.
of course this is important that you are a risk avoider of trader or a risk lover of trader.Tony , you must have practice and practice and to increase knowledge .i think you will be a great trader in the FX market . please God
i remain yours truly
hussin
dear Tony , for example
i have showed a bearish shooting star pattern in the past days ( 9 day ago) . pls pay attention to CAD LFX DAILY (9 day ago).
after this pattern we have seen a free fall for CAD LFX DAILY. pls see to CAD LFX DAILY ( Friday ).
dear Tony , for example
i have showed a bearish shooting star pattern in the past days ( 9 day ago) . pls pay attention to CAD LFX DAILY (9 day ago).
after this pattern we have seen a free fall for CAD LFX DAILY. pls see to CAD LFX DAILY ( Friday ).
Ignored
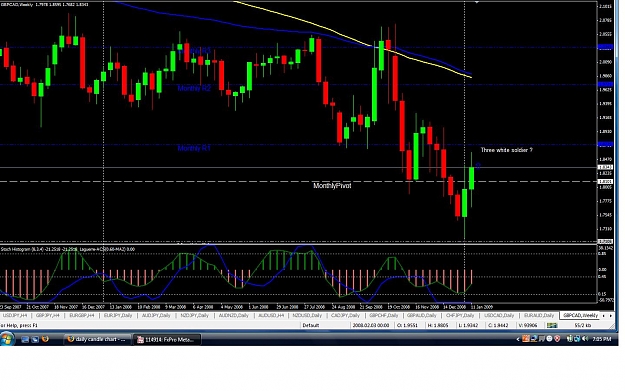
now look in the FX market (USDCAD)
whether you can see a buy signal in 9 day ago ?
in fact we can see a buy signal (bullish inverted hammer pattern )in 6 day ago .!!
now look in the FX market (USDCAD)
whether you can see a buy signal in 9 day ago ?
in fact we can see a buy signal (bullish inverted hammer pattern )in 6 day ago .!!
Ignored
hi hussin,
may i ask you if this can be considered as evening star pattern or bearish engulfing? thanks in advance.
p.s. i'm beginning to see candle stick patterns, and was wondering if there is any books you can recommend.