thank you KG you have inspired me to trade japans pairs on the system we are developing in another thread here and you are doing a great job here so i thought why don't we mix a little and you should do it guys coz the things you are missing here is the price action wich can be optined by COG system...
thank you again....
Ignored
Salam DeadSoul,
Glad if it's inspire you. Price action is one of importants thing when we analyze the chart before we make a decission. Anyway, thanks you have been here visiting us.
Glad if it's inspire you. Price action is one of importants thing when we analyze the chart before we make a decission. Anyway, thanks you have been here visiting us.
Regards,
KG
Ignored
Is there a multi TF price action indid for the JPY pairs that we don't know about..... that's a nice idea!
Did you have any luck with that STRONG/WEAK (#) all JPY pair ind' I was on about?
|
Commercial Member
|
Joined Apr 2007
|8,331 Posts
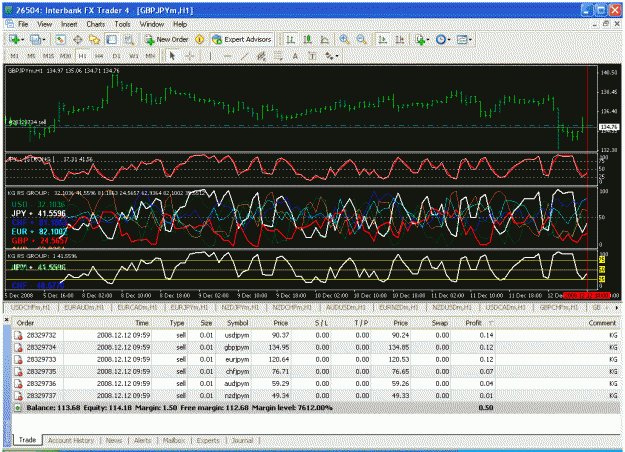
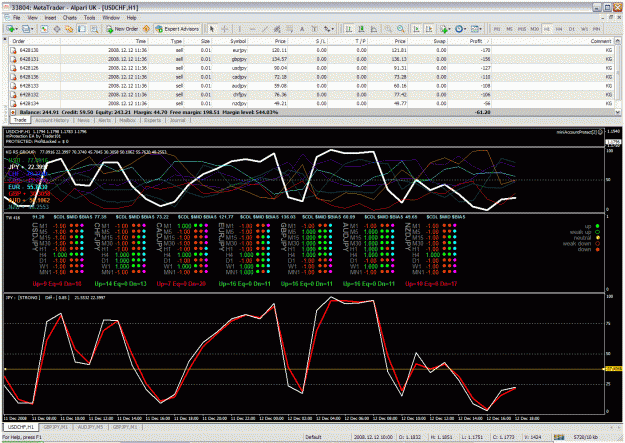
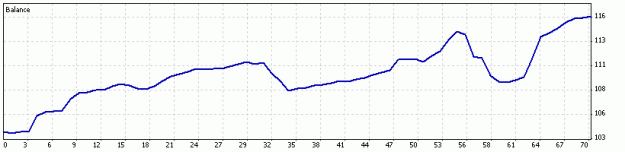
I have to go out soon, so it looks as though my trading is done for the week.
Statement attached, with some details deleted as this is a live account - tiny, but still my actual money.
All I have done this week is: go strong at or below 25, tp $2; go weak at or above 75, tp $1. I simply waited for the strength movement to stall and turn around slightly before taking out a position.
In round figures, the $11.48 profit represents 11% of the balance for minimal risk.
Happy week.
Next week, I shall write an ea to do the trading for me - won't take long.
Have a pleasant weekend folks.
Edit: I had trouble uploading the statement, so it is attached as a zip file.
Go weak when the KG RS GROUP JPY strength turns around from the 75 or above level. Tp $2, or roughly 200 pips.
Go strong when the indi turns around from the 25 or below level. Tp $1.
The reason for the different tp's is the mediumlong term strength of JPY as shown by your moving averages. It seems logical to me that an increase in JPY relative strength will have further to run than a decrease.
I emailed you this morning. KG. Let me know if it does not arrive.
thank you KG you have inspired me to trade japans pairs on the system we are developing in another thread here and you are doing a great job here so i thought why don't we mix a little and you should do it guys coz the things you are missing here is the price action wich can be optined by COG system...
thank you again....
Glad if it's inspire you. Price action is one of importants thing when we analyze the chart before we make a decission. Anyway, thanks you have been here visiting us.
Regards,
KG
Ignored
Salam KG..
the honer is mine..
your indicators are so great ..
but what i meant is for example to use something like Bollinger Bands at least it will show you where things are going referring to the price action..
and one of its secrets that some people don't know is that when ever the price reflect of one of its lines its A MUST TO REACH THE OTHER LINE THE CENTER OR IT WILL GO DOWN TO THE BOTTOM...
i hope this can help..
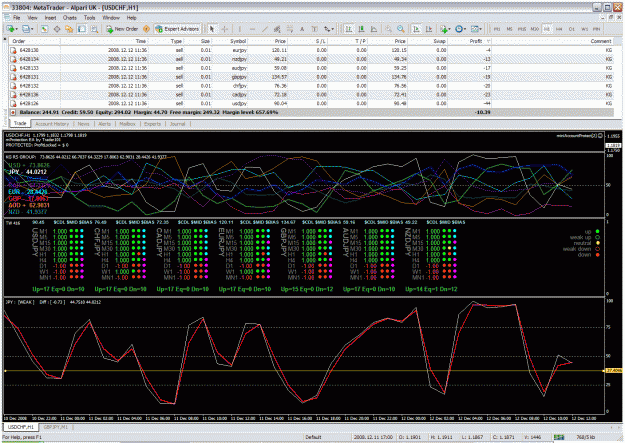
I have just the EUR and USD indicators displayed on a 5 minute chart. I've been checking the last 3-4 five minute bars and following both the EUR and USD values on the close of the bar. The values change when we're 2-3 minutes into the new 5 minute bar. Has anyone else noticed this? Many systems rely on the values at the close of a particular bar. So how can this be relied on for trading?
I have just the EUR and USD indicators displayed on a 5 minute chart. I've been checking the last 3-4 five minute bars and following both the EUR and USD values on the close of the bar. The values change when we're 2-3 minutes into the new 5 minute bar. Has anyone else noticed this? Many systems rely on the values at the close of a particular bar. So how can this be relied on for trading?
Ignored
I believe it's caused by the indicator should calculate 28 pairs. Just try to use good connections..
Salam KG..
the honer is mine..
your indicators are so great ..
but what i meant is for example to use something like Bollinger Bands at least it will show you where things are going referring to the price action..
and one of its secrets that some people don't know is that when ever the price reflect of one of its lines its A MUST TO REACH THE OTHER LINE THE CENTER OR IT WILL GO DOWN TO THE BOTTOM...
i hope this can help..
Ignored
Salam brother,
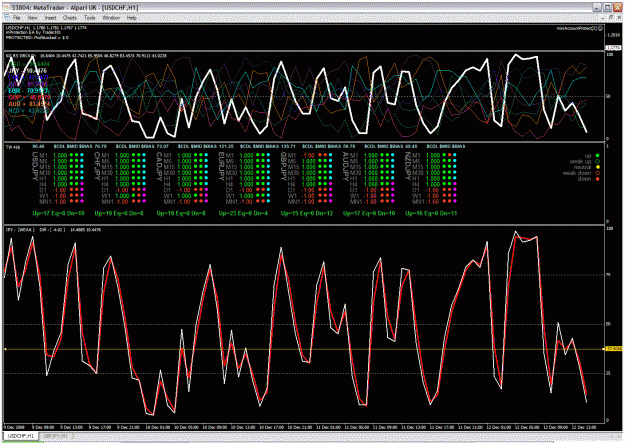
Yes, we use S/R in analysis. Some people here use classic S/R, BB etc. And i use BB 120 SD +1, SD +2, SD +3 on H1 time frame. And if you read at beginning you will found that i suggest to use dynamic S/R using EMA 480 high & Low for monthly trend, EMA 120 high & low for weekly trend and EMA 24 high & low for daily trend on H1 TF as our base TF.
Yes, we use S/R in analysis. Some people here use classic S/R, BB etc. And i use BB 120 SD +1, SD +2, SD +3 on H1 time frame. And if you read at beginning you will found that i suggest to use dynamic S/R using EMA 480 high & Low for monthly trend, EMA 120 high & low for weekly trend and EMA 24 high & low for daily trend on H1 TF as our base TF.
I believe it's caused by the indicator should calculate 28 pairs. Just try to use good connections..
Thanks
KG
Ignored
Hello Kang. Thanks for the response. I have a dell inspiron laptop which connects wirelessly to my home network which is connected to comcast.net. I'm not a tech guru so perhaps you or some others can give me some pointers on how I can get a better connection.