Dislikedsome things:
1) based on the picture you uploaded a few posts ago, your entries are DEAD WRONG except for the first 1. but even then, you already missed the entry.
buy:
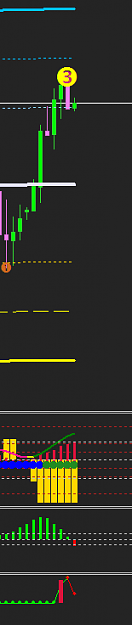
-see a dip downwards on the "jim life" indicator
-there is a green bar on the abha timing signal
-near the bottom of the cog band.
sell:
-see a spike upwards on the "jim life" indicator
-see a red bar on abha timing signal
-near the top of the cog band.
don't take the trade unless you meet these conditions. they happen more often than you think. just need some patience....Ignored
Thanks for the reply thelws.
Some follow up questions:
1) You said to see a dip 'downwards' for a 'buy' signal on the jim life indicator. That doesn't make sense to me because a downward spike on the jim life would be red, so if price is going down (red) and hits the bottom, then turns up and becomes GREEN, only then would we see a buy condition. So technically, I would have to see a spike upwards instead of downwards...... is that not so?? If I am wrong then please explain more clearly.
2) If pricehits the bottoms of the COG and buy signal is generated but the COG is POINTING DOWN, would we still enter a trade....because the price is touching the bottom of the COG, or would we stay out because the COG is pointing down.??
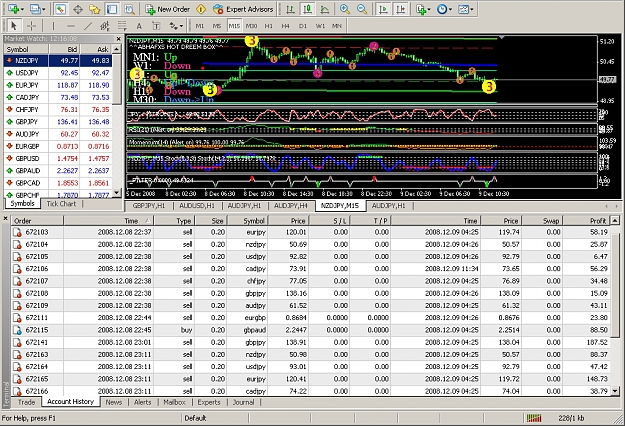
3) Referring to the screenshot I posted: CHFJPY is fine. EURCHF: I entered a sell trade based on the fact that price was touching green line above center line, and COG was pointing down and JIM gave me a sell signal. Price then moved up and signal repainted...How could I have avoided that? GBPCHF: I think I entered at wrong time because price was not touching a resistance line on the COG...is that correct? AUDCAD: I think same problem as GBPCHF, is that correct?
4) About the stochastics, r u using the stochastic from 'paulus' template, the cyan bars and colored stochastic? If so, plese explain how you use them on the 4H chart. Thanks.