On the template the chart graph is configured to "line graph" and color set to none. If you want to add normal candles (though it would look quite messy) just change the style to "candlesticks" in the program menu.
Good post, BTW.
Ignored
Right doblece, on the V1 version I changed the candles to the same color as the HA candles and you can shortly change to Candlesticks to see the shadows if desired.
I am wondering if an encoded alarm can be customized. I noticed that with pre-programmed alarms they only deliver the the alarm one way (like pop-up text). I would like to make it be a sound alarm or even an email alarm so I can ring my cell phone. I sleep during first half of London so I currently program a price alarm to wake me but half the time it is a "false" alarm. I don't know if this can be done (maybe doblece knows) but is it possible to encode a custom alarm so that it has an option to employ different types of alarms (mail, sound, text...etc)...
Ignored
Yes it can be done.
There are three kind of alerts possible on MT4:
"alert" = pops up a window and plays a sound
You can add any values, separated by commas. It can be up to 64 parameters. For example:
Code: Alert (Symbol(),"(blank space) ",Period(),"text of the alert", Close[0]);
This would print like this on the popup if on an EURUSD chart in M1 TF and current candle closing at 1.2631:
Alert pop text box + sound:
Quote
Disliked
EURUSD M1 text of the alert 1.2631
"playsound" = only plays the selected sound
Code: PlaySound ("nameofsound.wav");
You can add any sound you wish to the "sounds" folder, provided it is in wav format. If you want a voice, there's a cool demo here at AT & T where you can record text to voice and save it in wav format with very good quality. They have 15 voices (male and female, various languages)
"send mail" = sends an email through the configured email parameters (you have to set up this first on your platform).
Here's the Meta Editor sample for sendmail:
Inserted Code
double lastclose=Close[0];
if(lastclose<my_signal)
SendMail("from your expert", "Price dropped down to "+DoubleToStr(lastclose,Digits));
Where the first text is the title, and the second the body of the email.
An alert (any of these) can be programmed to be triggered when a particular condition is met. It is easy to include the line in the code just after the condition to be met.
There is also a Send FTP function though I don't think it would be of use as an alert. (sends a file to a server address)
You can have both Alert OR Playsound WITH SendMail.
Alert and Playsound can be triggered sequentially but only in an EA, by setting a delay between both (if not, only the Alert would sound).
However, you can use any of those simultaneously with SendMail (you can test this also in the Alerts tab of the Terminal window, by setting two alerts at the same price or time both to sound and mail)
Yes it can be done.
There are three kind of alerts possible on MT4:
Alert pop text box + sound: "playsound" = only plays the selected sound
Code: PlaySound ("nameofsound.wav");
Ignored
That would be great having a pirats voice screaming on color change:
I really want to be able to contribute to this thread so that I can feel useful too !!!
This indicator FXOE-ShiChannel...looks for tops and bottoms and draws a channel automatically...it does, often enough, find levels of support and resistance.
The other comment that I had is that...on the + Daily Pivots + marker on the screen in the yellow circle...I tried to rearrange the S1,2,3 on the bottom and R1,2,3 on the top as resistance is on top and support is on the bottom...
I was thinking that perhaps there are too many levels on the chart??? You guys don't think so??
I included a naked chart for the 1hr, 15 min and 5 min with the daily pivots...I am on EST so I set the time to -5...it calculates the pivots based on a 24hr GMT time frame, basically the OHLC of the daily candlestick of a GMT time session. It does handle the sunday issue. I posted it earlier but I did not get a response...
Yes it can be done.
There are three kind of alerts possible on MT4:
"alert" = pops up a window and plays a sound
You can add any values, separated by commas. It can be up to 64 parameters. For example:
Code: Alert (Symbol(),"(blank space) ",Period(),"text of the alert", Close[0]);
This would print like this on the popup if on an EURUSD chart in M1 TF and current candle closing at 1.2631:
Alert pop text box + sound: "playsound" = only plays the selected sound
Code:...
Ignored
Thanks a bunch. From what I have looked at from mq4 coding syntax, it looks relatively easy. But just like any programming, it takes time to encode and test. So I will start with the quick and easy stuff and go from there. You are a treasure of information.
I really want to be able to contribute to this thread so that I can feel useful too !!!
This indicator FXOE-ShiChannel...looks for tops and bottoms and draws a channel automatically...it does, often enough, find levels of support and resistance.
The other comment that I had is that...on the + Daily Pivots + marker on the screen in the yellow circle...I tried to rearrange the S1,2,3 on the bottom and R1,2,3 on the top as resistance is on top and support is on the bottom...
I was thinking that perhaps there are too many levels on the chart???...
Ignored
Any feedback, positive or negative is useful. So keep on posting!
That looks like a cool indicator. I'll have to try it on my standard candle chart.
I don't think there are too many levels. I have noticed a couple times on big moves that I run out of fib pivots. I like to know where the s/r's are because of my conservative trading nature. If PA stays within "normal" s/r's the others usually aren't even visible anyway, without chart expansion, so they aren't in the way.
And don't get me started on the calculation time of pivots - I have already wasted enough forum space blabbing about that!
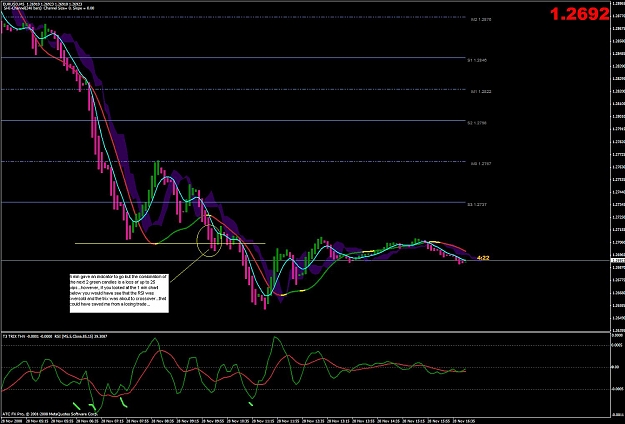
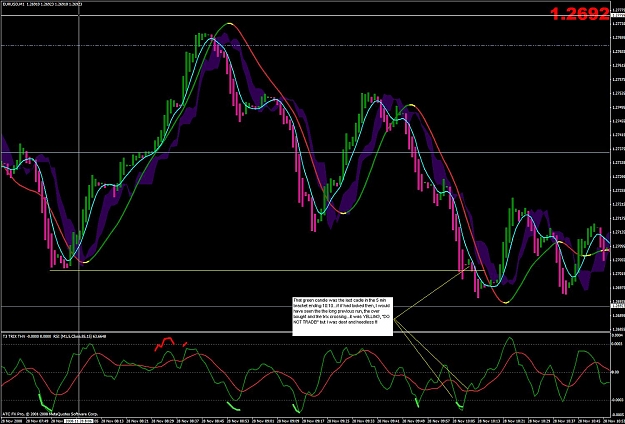
I wanted to show y'all why it's important to look at the other time frames, higher and lower...I entered a trade on the 5 min, when clearly if I had looked at the 1 min, I would have seen that
A: it had come down from a pretty long run and was bound to retrace
B: RSI was oversold
C: TRIX crossed over in the next 1 min candle...
That could have saved me losing 20 pips...
Silly me...
PS: Thanks for the kind words Tradewell...
Attached Image(s) (click to enlarge)
Deprive a man of everything and you give him nothing to lose.
Thanks, when will V2 come out? I am looking forward to having it.
Happy thanksgiving!
Lily
Ignored
I think it will take about two weeks to be sure that the changes will improve the trading results or not. I will announce the release as soon as possible.
Till then you can trade the V1 that works pretty well.
I wanted to show y'all why it's important to look at the other time frames, higher and lower...I entered a trade on the 5 min, when clearly if I had looked at the 1 min, I would have seen that
A: it had come down from a pretty long run and was bound to retrace
B: RSI was oversold
C: TRIX crossed over in the next 1 min candle...
That could have saved me losing 20 pips...
Silly me...
PS: Thanks for the kind words Tradewell...
Ignored
It's a question of perspective, timing and of using the proper stops for a given timeframe. For example, I entered that same trade but later on, on the open of the 10:45 candle (after the small retracement) and am still in the trade, with 10 pips locked... When scalping on M1-M5 and especially if I see that we might be approaching a bottom, I lower the stop as soon as I have 6-10 pips (depends on how I see it moving). I entered at 1.2714 and price didn't come back to get me, presently at 22 pips with 10 pips locked because of the weekend (gambling on a gap down, but safe).
Joined Mar 2008
|
Status: PVSRA with Traderathome
|23,246 Posts
This is for Cobraforex and anyone else that might be able to help.
I am at a standstill on a really nice revision to one of the THV indicators. My problem is simple, and is as follows:
To get the time at the right most candle on the chart, which is the current candle, the code is ...... Time [0] .......
I need to be able to get the time at the leftmost candle on the chart, the candle that will disappear from screen when the next rightmost candle appears. Does ANYONE know the code to do this.....?!!!!!
Ignored
The problem with this indicator, is that it is not only giving the time "AT" the rightmost (current) candle, but also is giving the time "OF" the current candle... so maybe you could use another time indicator as the previous BarClock, which gives how many minutes have elapsed since the start of the current candle, and which itself can be moved to another place on the screen.
The problem with this indicator, is that it is not only giving the time "AT" the rightmost (current) candle, but also is giving the time "OF" the current candle... so maybe you could use another time indicator as the previous BarClock, which gives how many minutes have elapsed since the start of the current candle, and which itself can be moved to another place on the screen.
Ignored
Having code that returns the time "at", or "of" the LEFTMOST candle on the chart is what I need. Either "at", or "of" will work, and resolve a BIG headache and roadblock to getting this indicator revision out.
By being able to get the time (at,of) the leftmost candle, I can compare it to the time for a Period Separator. So when the period separator is at the leftmost candle (both times equal), and about to disappear, I can switch to alternate coding for lines and labels of the pivots and other displayed lines.
Ignored
I understand what you say. I thought you only wanted to change the place of the display.
But now, how many candles before is your leftmost candle? And will it be the same for every timeframe?
When I was saying "AT" added to "OF" I meant that the system calculates how much time is left (running time) for that specific candle, while any leftmost candle would be already "finished" so how to calculate its time?
If you want to know which time it is on the leftmost candle, I think the only time you will get is the server time (I don't know though if local time would also be available, maybe it is because alerts work on local time of the computer), so setting up a vertical line at that place would be enough? Or do you want it to "go forth" and advance with every closed candle?
If so, most probably the code for "Time" function would be "Time" [minus x number of candles] - ("0" being the current candle) and it will have to be different for each timeframe... which can be done with a "Case" declaration.
I understand what you say. I thought you only wanted to change the place of the display.
But now, how many candles before is your leftmost candle? And will it be the same for every timeframe?
When I was saying "AT" added to "OF" I meant that the system calculates how much time is left (running time) for that specific candle, while any leftmost candle would be already "finished" so how to calculate its time?
If you want to know which time it is on the leftmost candle, I think the only time you will get is the server time (I don't...
Ignored
This discussion refers to upcoming SDX-TzPivots_v4 release. It has some nice cosmetic changes and expansions. Period Separator labels "Yesterday" and "Today" can be placed at top or bottom of screen to get them out of the way of the chart body. Previous session H/L and current session Open have been added back. Fib levels are increased by 2 to a total of 5.
Two bugs were that chart TFs would not get their lines until the first TF was complete. So, at the beginning of a session, you had to wait 30 minutes for the lines on the 30 chart to draw, even though the labels were already there. This, I believe I now have suitably fixed.
The second bug was dealing with line labels once the Today Separator disappeared off the left side of the screen. This is the task at hand. I have the alternate code to place labels on the screen but I need a trigger to switch to the alternate code. The best trigger is to compare the Separator time to the time near the end of the chart.....when they equal, or get even close to each other, then switch coding methods. Since charts can be scaled in and out, the last visible candle can change with scale, and of course, with different TF charts.
If anyone can help with some sample coding for this, I would greatly appreciate it. It would be great if there was some way to tell what the time was at the left of the screen......any chart TF, any scale.....so it can be compared to the time at the Period Separator. Then, within a proximity of time, the direction to alternate code becomes effective.....
It would be great if there was some way to tell what the time was at the left of the screen......any chart TF, any scale.....so it can be compared to the time at the Period Separator. Then, within a proximity of time, the direction to alternate code becomes effective.....
Please, anyone, I need help on this.
Ignored
Yes but... "the left of the screen" can differ A LOT not only depending on the time frame, but also if you are using the chart full screen or differently sized., if it is shiifted or not and how much...
This is what I see difficult. And if it is only for testing purposes, as I said: just set a vertical line on the leftmost candle...
If it should be part of the new indicator, a standard should be defined as to the minimum size of the window for the label to show properly and be visible.
Edited:
Here's an indicator that apparently show a vertical line that moves with price. I haven't tested but just in case you want to have a look at the code to see if it could work for you?
I found it here: http://www.forex-tsd.com/suggestions...s-promise.html
Just tested, you have to set "draw as background" to "false" for it to show the price on the lower time bar. You can configure it to the number of bars back that you wish, and it will be advancing at every next candle open along with the chart. It is not exactly what you wanted but it can be of use meanwhile we can find something better...
Yes but... "the left of the screen" can differ A LOT not only depending on the time frame, but also if you are using the chart full screen or differently sized., if it is shiifted or not and how much...
This is what I see difficult. And if it is only for testing purposes, as I said: just set a vertical line on the leftmost candle...
If it should be part of the new indicator, a standard should be defined as to the minimum size of the window for the label to show properly and be visible.
Edited:
Here's an indicator that apparently show a...
Ignored
Thank you for posting that indicator, Doblece. I will look into its coding ASAP. Meanwhile, I have been hard at work on this problem and may have created a "fudge factor" code set that will work reasonably well in the event "exacting code" does not present itself.
From the EJ charts below you can see when you go down from a 15 chart that shows all the labels in the vacinity of the Today Period Separator, to the 1 chart, where that separator is long gone off the left of the chart, the "fudge factor" code sensed this and placed the labels back on the screen. The indicator window allows for this column of labels to be moved left and right.
There is the "Full Screen" mode, too, that looks on all TFs like it does here on the 1 minute.....vertical column of labels that can in the indictor window be moved left and right..
Some of this is in what is already out there, but the in-work version is cleaner and with more flexibility......and more reliability, hopefully.