NONE of those settings produced anything positive in a sideways market....
Ignored
Nice work Todd. I have had a look at a few of those settings as well and can confirm that I have found the same, perhaps unsurprisingly. I don't feel many indicators anyway will work in a ranging market to be honest.
I have found that the repainting is not much of an issue as long as one waits for the candle to close on the QQE cross as yesterday I took a cross mid-candle forming and it promptly uncrossed and resulted in a 10 pip loss.
I am with you completely on the risk issue too, allowing the price to run 50 pips against one's position is a no-no as far as I am concerned.
In fact this morning I now wait until 5 or 10 seconds at most before candle close before entering a trade to make certain that the QQE cross confirms.
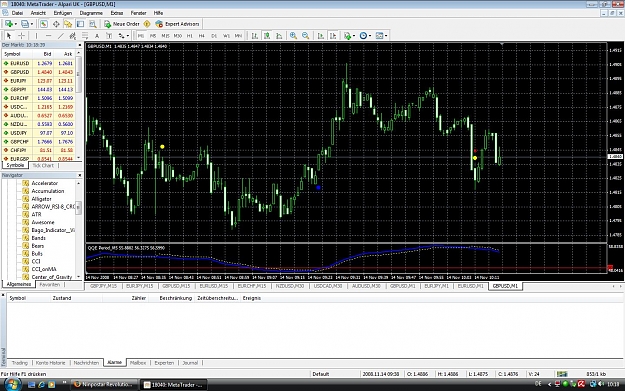
I don´t take these trades, see attached screenshot.
The second sell cross came after a violent move down, usually a rather late signal then, so I prefer to wait for the next signal and stay out of the market.
Sometimes price turns around right after, causing a big loss and of course sometimes price continues in the correct direction.
hello thanks for your system. BTW may i suggest somethin? maybe we should combine this system with candle stick formation like shooting star, doji etc to make the entry. what do you people think?
hello thanks for your system. BTW may i suggest somethin? maybe we should combine this system with candle stick formation like shooting star, doji etc to make the entry. what do you people think?
Ignored
Pretty sure that candle patterns have much less significance on the 1M TF and I still need to be convinced of their worth on higher time frames too - same for Fibonacci retracements, I have no faith in them either (imho).
Whereas I have little confidence in the above (patterns and Fibs) I must say that placing an order around a pivot looks fraught with danger and I am looking to see if there is a safe distance from a pivot that one can safely and confidently, place a trade.
I have a feeling that the market sentiment is the sole and only determining factor in price movements though and no amount of indicators, fibs or pivots on our charts ultimately makes any difference at all to where the price moves
I don´t take these trades, see attached screenshot.
The second sell cross came after a violent move down, usually a rather late signal then, so I prefer to wait for the next signal and stay out of the market.
Sometimes price turns around right after, causing a big loss and of course sometimes price continues in the correct direction.
For me, just too much of a risk.
Ignored
Agreed! Occurred just after 0800 GMT and maybe a time to take extra care? And always check the calendar for News Announcements prior to placing an order in the market - goes without saying?
WPR = Williams Percent Range.
Why those particular settings?
I don't know. I got them someplace else and they seem to work. WPR 228 when the 228 is above 388 you can also be looking for longs even though both are above the -50 level ( It's not an exact science) you can also look at the ma 8 of the wpr 30 and take trades on that cross.
But the purpose I was using it for was confirmation of direction and it's pretty good for knowing when to exit a trade ( when it runs out of steam, exit) even though the QQE still signals ok, I will wait on a return to a more favorable level and enter again with the trend.
Can anybody tell how the QQE indicator works exactly? Or perhaps a link to the its definition? (I cannot find anything useful in Google )
I saw someone posted an image showing that MACD and QQE plots exactly the same curve. Then what is the difference between the two?
Thanks
Ignored
Copied and pasted from another forum thread (fxfisherman)
1) Create an exponential moving average of RSI; the periods (length) is user-defned, default value is 2.
2) Create the 14-period ATR indicator based on the EMA of RSI.
3) Create the 2 trailing stop lines
3a) fast trailing stop is the ATR smoothed with a 14-periods wilders() smoothing function that is multiplied by a factor of 2.618
3b) slow trailing stop is the ATR smoothing with a 14-periods wilders() smoothing function that is multiplied by a factor of 4.236
WPR = Williams Percent Range.
Why those particular settings?
I don't know. I got them someplace else and they seem to work. WPR 228 when the 228 is above 388 you can also be looking for longs even though both are above the -50 level ( It's not an exact science) you can also look at the ma 8 of the wpr 30 and take trades on that cross.
But the purpose I was using it for was confirmation of direction and it's pretty good for knowing when to exit a trade ( when it runs out of steam, exit) even though the QQE still signals ok, I will wait on a return...
I put the indicator on my chart, with the levels -10 -50 and -90
But i can´t found or how i can set the lines 30 green, 88 blue, 228 red and 288 white.
Copied and pasted from another forum thread (fxfisherman)
1) Create an exponential moving average of RSI; the periods (length) is user-defned, default value is 2.
2) Create the 14-period ATR indicator based on the EMA of RSI.
3) Create the 2 trailing stop lines
3a) fast trailing stop is the ATR smoothed with a 14-periods wilders() smoothing function that is multiplied by a factor of 2.618
3b) slow trailing stop is the ATR smoothing with a 14-periods wilders() smoothing function that is multiplied by a factor of 4.236
Hope this helps you Arilou....
Ignored
Thanks for explaining. So if QQE is made of RSI-s and ATR-s, I wonder how is it possible that it resembles so much to MACD (not only resembles, practically identical).
BTW, does anyone have positive live results with this sistem since? I also experienced the repainting issue, and it seems really serious. A dot can appear and disappear several times, until the higher timeframe candle closes. Yes I know that not switching the TF-s leaves the dots as they are, but then the dots are false.
I entered a trade at a new dot on 1M TF, and the trend turned against me immediately and continued that way. When I switched to the 5M TF, and back again, the dot was not there any more, and the curve became smooth and perfect again, indicating the countertrend (that had been previously overriden by the false signal).
So I really wonder if there is a way to use this system profitably. Or should I wait for the higher TF candle to close, before I believe any signal? But then what is the point in using it on a 1M TF? It would be simpler to use it on the same TF as the QQE period, no?
Regarding the 3rd signal:
that was too risky for me. I am using 60/1, this strategy works fine on nice slow moves upwards and downwards. But if there are 1 or 2 bars which are dramatically longer than the others - I would not enter, as many times there is a reversal right after. And if then QQE is giving a new entry signal - the loss can be too high.
I just wait for the next signal.
Try out 60/1 settings. The signals are very similar to 60/5 and the dots do not repaint. Just take a currency pair twice and use both settings for one day. I mean forward testing. At the end of your trading period, you can compare the signals between 60/1 and 60/5.
I am using 60/1 - does not repaint and gives several good signals during 0800 - 1700 GMT+1. Of course, it is definitely not a holy grail.
Also tried out 30/1 to get me into trades/ trends earlier but in a sideways market all profits accumulated disappear.
Just have a look at Gbp/Usd from 1000-1230 GMT+1 and also 1430-1630 GMT+1 using 30/1. During such periods one may loose quite more often than winning, so I would generally recommend a higher smoothing factor.
I do not wait for the next QQE cross signal to exit.
Usually exit at +15 -20 pips.
But really - losses can be so big and trading without a stop loss is not a good idea.
Still have to perfect this trading strategy with some sort of filter.
I put the indicator on my chart, with the levels -10 -50 and -90
But i can´t found or how i can set the lines 30 green, 88 blue, 228 red and 288 white.
Can you post your template here to see or use it.
Thanks a lot
Ignored
I like your stenght indicator on the different timeframes in the top RH corner of your chart, (ema and MACD) is that posted anywhere on this site