DislikedIn those charts you see a blue standard Bollinger band (period 20, deviation 20) and a green inner Bollinger band (period 10, deviation 1.5). The fibonacci extension was measured across the pinch of the green Bollinger band. I have set my fib ext. tool so that is all I have to do, and the tool draws the extension levels both upwards and downwards. Normally, you will have to apply the measured extension to the lower pinch point to get the downward extensions to draw, and apply it to the top pinch point if you want the upward levels drawn.Ignored
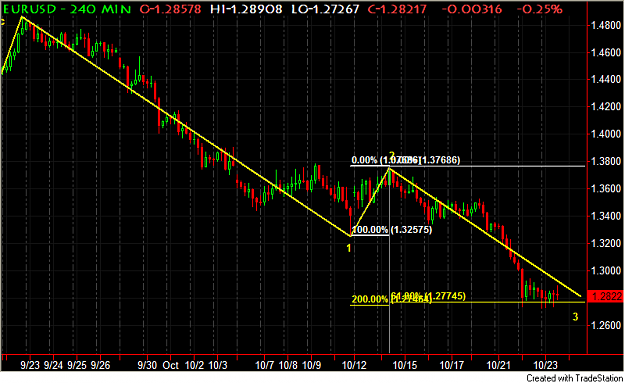
Here is my 240m chart once again, this time showing a standard fib extension of 61.8% of wave 1 projected down from wave 2 high and 200% external retracement of wave 2. Same level as your 838% ext:
Attached Image (click to enlarge)