No luck on that pair. Pay attention to my mistake for fighting the trend. As long as no TL's is broken to the upside (in this case) the trend is down and without few if any expectations should you trade against the trends.
Ignored
Good day eadiaz. Actually theres been some perfect trades on GBP/JPY (actually all JPY crosses) using templates #18.1 and #18.4 from Igrok.
I don't use fibs for this task. HL/HH and the opposite should only be used when price is trending. If price is not trending it's no point of using them. So if price is trending upward, only look for retracements to plot HH/HL. And remember that this is not a tradeable system, its simply a helping-tool to define a (potential) trend.
On posted chart I've tried to explain what I mean by swings.
Ignored
Hi aediaz1
Thanks I have a new light in my head ;-)
On my chart you can see one pullback 's execeeded last HL what does it mean ? and what's his name ?
"its simply a helping-tool to define a (potential) trend" there is rules with this process to define the trend example numbers of swing or after 2 or 3... ?
Thank a lot for your hand
Regards
Ignored
Hi. No TA tool will ever give you the 100% success-rate luxury. This is a very hard issue for most new traders to accept and when I see people fail to accept the truth that losing is a part of trading you can't skip (that's why preserving your capital is so important) like when I tried to teach some of my friends some simple TA setups, it become very hard to continue because they will simply give up when they see something fails for once even when it have proven to work many times before.
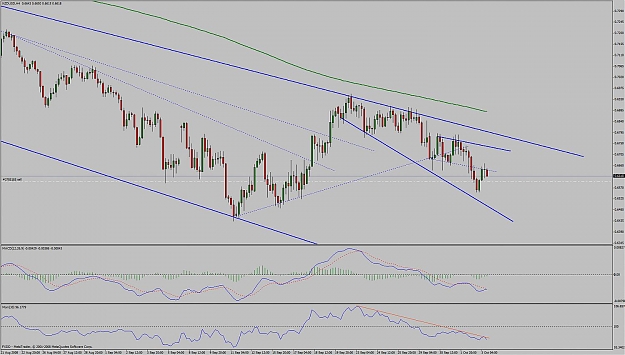
When a LH in a downtrend is exceeded, it will, in most cases, be a sign of weakening down-trend. In other terms, a probability. You can call it a new high if you want to
Lord, give us 3 successive close below this last significant LH and I'll hold into this trade till I have grand kids
You might say hah 175 pips is nothing. I say that the pip-value on this pair is almost twice the amount compared to eur/usd. Still not impressed ? Good, I'm not here to impress anyone
Hi. No TA tool will ever give you the 100% success-rate luxury. This is a very hard issue for most new traders to accept and when I see people fail to accept the truth that losing is a part of trading you can't skip (that's why preserving your capital is so important) like when I tried to teach some of my friends some simple TA setups, it become very hard to continue because they will simply give up when they see something fails for once even when it have proven to work many times before.
When a LH in a downtrend is exceeded, it will, in most cases, be a sign of weakening down-trend. In other terms, a probability. You can call it a new high if you want to
Ignored
Hi aediaz1
I'm newbies on Forex but since 1 year I try to undrestand this job 8/10 hours by day and i anderstood that I am in the middle of "chaos theory" and future never can to be predict and failure it's always around on all business look at this time " big banks big country failure" my ask was only because i'm deformed by my past job i like the precision first tool i learnt on Forex was MM and this one continous to protect my balance
On my chart now i plot the trendline it's only on this case or there is another alternative ?
Thanks have a good weekend and goods trades eurgbp looks cool ;-)
Regards
Ignored
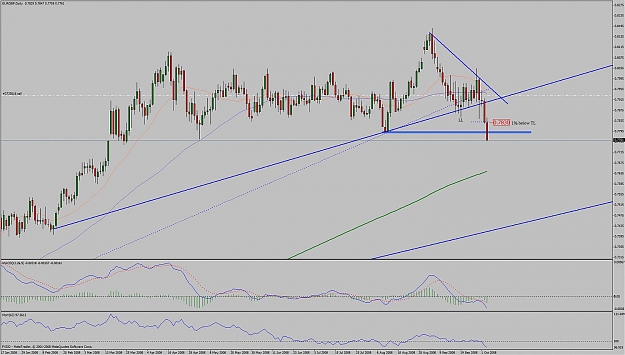
It seems that you're trading of daily chart and that's a good start. Less stress, IMO.
Your TL is correct. One advice based on past experience; when TL have such downward angle as in your case, break of those lines tend to spark only limited moves because the trend is so strong. Don't take my word on it, better watch and see yourself what happens when we have lines almost vertical. Also, your trading of a pair I share no experience with.
Regarding eur/gbp, it's already slapping me for trying to predict where it will close in 5 hours
Few of the price-patterns I've been trading in these crazy days is double tops/bottoms on lower TF. No doubt that investors are fearful, when price seems to hit a price-level more than twice, price seems to reverse very quick.
Just an observation, not an rule carved in stone.
I've closed half the position when target was achived and let the rest run. Got quite lucky on gbp/chf and aud/usd DT's and managed to ride along for a bit;
Loads of quality information all condensed into one thread! Thanks for the informative read aediaz1. This is probably one of the best summary of important TA knowledge I have seen, it is like the essence of babypips, but more in-depth.
Particularly good insights on how to recognize proper breaks by adopting a 3 day confirmation. This is something new to me.
Also, really appreciate how you explained the various means to trade patterns such as double tops/bottoms, the breakouts of triangles/wedges and with confirmation from divergences.
More insight into price action would have been great, would love to hear your opinion on e the good candlestick formations.
Pattern that signs exhaustion of the currently bull/bear run and a break to the opposite direction of the wedge is expected. But there is no such thing as always in this market.
Calculation of potential targets;
Downward wedge; Take the lower TL and copy its angle and attach it to the starting-point of upper TL.
Upward wedge; Take the higher TL and copy its angle. Then attach it to the starting-point of lower TL.
To copy any line in MT4, mark line and press down CTRL bottom while you drag it.
Ignored
Hi, great thread and I already learned alot. I have been trying to use these things with pain and suffering and distress and miserable failure.
I have a question about the MACD, Im using meta trader on ODL. On my MACD I dont have 2 moving averages. You have the navy blue and the dotted red plus the green bars. I only get 1 moving average and the bars. Did you add one of the moving averages (blue or the red dotted) manually as a MA?
Loads of quality information all condensed into one thread! Thanks for the informative read aediaz1. This is probably one of the best summary of important TA knowledge I have seen, it is like the essence of babypips, but more in-depth.
Particularly good insights on how to recognize proper breaks by adopting a 3 day confirmation. This is something new to me.
Also, really appreciate how you explained the various means to trade patterns such as double tops/bottoms, the breakouts of triangles/wedges and with confirmation from divergences.
More insight into price action would have been great, would love to hear your opinion on e the good candlestick formations.
Thanks again! Enjoyed the read.
Ignored
Thank you for your kindly words. Appreciate it.
Talking about breaks, if you refer to TL breaks, the requirement is 1% on daily chart for a valid break. For a trend to reverse we need a TL break and 3 days close below the last significant LH/HL. The probability for it, that is.
I'll try to post some examples as we witness them in real-time with explenation. It's so easy to look back on any chart saying "look how great it worked" regarding candlestick setups
Hi, great thread and I already learned alot. I have been trying to use these things with pain and suffering and distress and miserable failure.
I have a question about the MACD, Im using meta trader on ODL. On my MACD I dont have 2 moving averages. You have the navy blue and the dotted red plus the green bars. I only get 1 moving average and the bars. Did you add one of the moving averages (blue or the red dotted) manually as a MA?
Cheers
Ignored
Good to hear. Well, I think its pretty hard trading of daily chart right now. That's why I've skipped down to smaller TF, trading double tops/bottoms.
|
Joined Apr 2008
|
Status: Controlled Trading.
|1,161 Posts
Hi Aediaz,
Long time don't post here.
Just a broadening triangle that could become a diamond on UJ mothly. Looks like we are headed up for good.
Spotted it on momentum indie as well.
Looks like we had a bottom of a broadening formation observed on H4 and Daily as well. We should have abreak on the top of this formation as it will be the fourth touch of that descending trendline around 105.60-105.80
Keep up the EXCELLENT thread!!
Cheers,
JP.
Ignored
Hi JP. Hope you're doing good. I haven't payed too much attention on the long-term yet, but I guess its time soon.