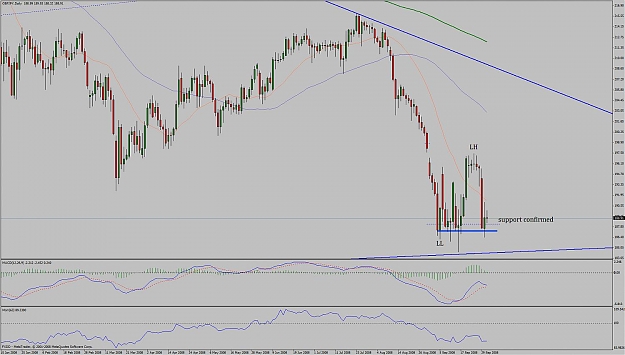
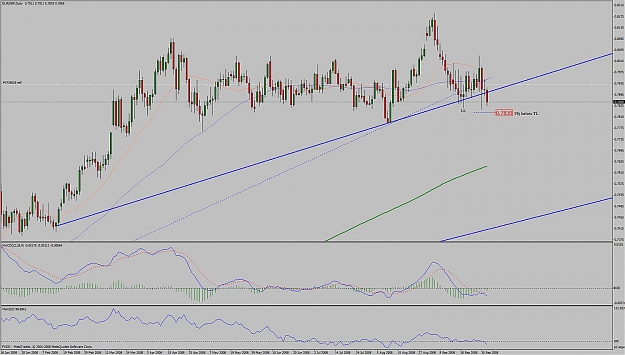
Gbp/jpy; Price closed above potential support. Blue dotted line is 0.5% above support. A bounce from here is in favour, according to my charts, and no resistance until previous LH on daily chart but that doesn't mean it's forced to visit previous LH.
Gbp/jpy; Price closed above potential support. Blue dotted line is 0.5% above support. A bounce from here is in favour, according to my charts, and no resistance until previous LH on daily chart but that doesn't mean it's forced to visit previous LH.
Ignored
Welcome back mate, hope you enjoyed your stay. Now lets get back to bussines. We have 4hr bullish divergence on GBP/JPY as well as other two main JPY crosses. RSI divergence is present and we still need a crossover on MACD, that we will get quite soon i guess. Divergence is targeting previous LH as well, priced in @ 197.417
Welcome back mate, hope you enjoyed your stay. Now lets get back to bussines. We have 4hr bullish divergence on GBP/JPY as well as other two main JPY crosses. RSI divergence is present and we still need a crossover on MACD, that we will get quite soon i guess. Divergence is targeting previous LH as well, priced in @ 197.417
Ignored
Thanks. I missed my charts down in Egypt more than I miss back to Egypt in Norway but I had a great time
It seems like the odds for bulls is starting to stack up. Have a look at weekly chart and see how quickly this area got bought up.
It's my first post on your thread and first i want to tell you thanks for your explanations ABC trading
I'm newbies and I need to learn these materials "perfectly" before other steps but that seems hard for me to understand correctly i post my study chart if you have time can you tell me if i'm in the rigth way ?
Thanks
Regards
Ignored
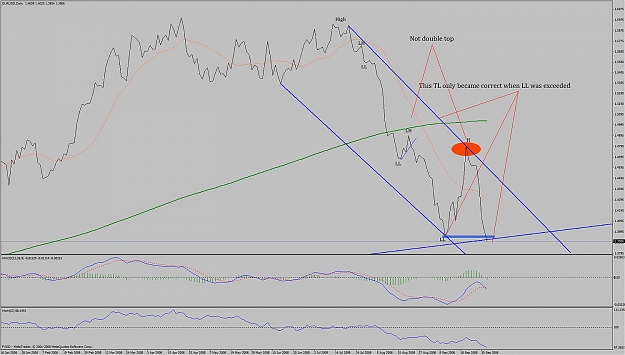
Hi. Your TL is correct. It should be easier to draw lines if you use closing-price.
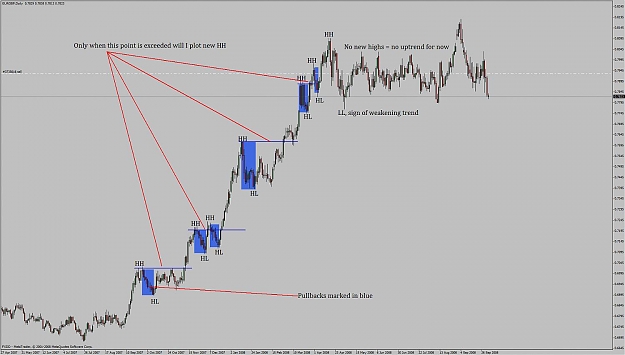
Regarding LH etc the easiest way to plot them is by putting them on swings. I'll try to explain with a chart.
I like to plot LH/LL HH/HL on signicficant swings. The first LH/LL you see on the top off posted chart is what I would consider as minimum swings. There nothing anything wrong plotting it on smaller swings, its just a matter of taste and style, IMO. If your still unsure, try and define LH/LL etc with a swing for at least 1%.
Practice your drawings with any backtesting-software. Great way to gain experience and a cheap way to learn too.
Gbp/jpy; Price closed above potential support. Blue dotted line is 0.5% above support. A bounce from here is in favour, according to my charts, and no resistance until previous LH on daily chart but that doesn't mean it's forced to visit previous LH.
Ignored
No luck on that pair. Pay attention to my mistake for fighting the trend. As long as no TL's is broken to the upside (in this case) the trend is down and without few if any expectations should you trade against the trends.
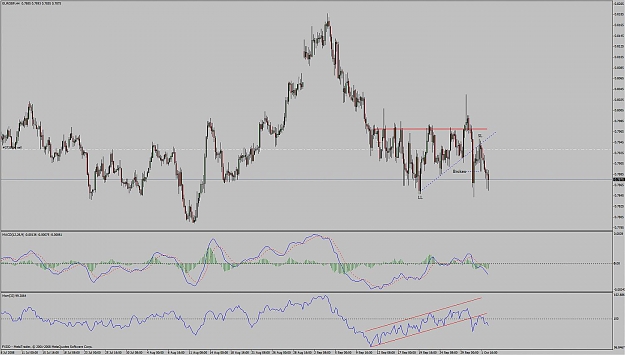
Here is a trade I took yesterday on eur/gbp 4h chart. I was lucky to see price make a pull-back to broken TL and could enter with a SL of 20 pips. The reason I didn't traded this the break, was that price was too close to previous LL. Watch how the momentum indicator and price hold hands on this trade.
If price closes @ .7830 on daily, TL is broken and I'll hold into this short.
What I forgot so say about pull-backs;
Make sure you see price respect the broken line on first test. If you're in any doubt, leave it.
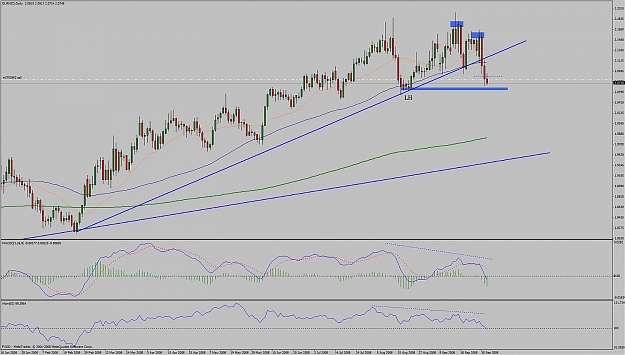
Here's another trade I took on eur/nzd. Divergence on both indicators. The next step is to watch for a close below previous LH (for 3 days below) to call this uptrend to an end.
Hi. Your TL is correct. It should be easier to draw lines if you use closing-price.
Regarding LH etc the easiest way to plot them is by putting them on swings. I'll try to explain with a chart.
I like to plot LH/LL HH/HL on signicficant swings. The first LH/LL you see on the top off posted chart is what I would consider as minimum swings. There nothing anything wrong plotting it on smaller swings, its just a matter of taste and style, IMO. If your still unsure, try and define LH/LL etc with a swing for at least 1%.
Practice your drawings with any backtesting-software. Great way to gain experience and a cheap way to learn too.
Hope this helps
Ignored
Hi aediaz1
I didn't await such a correction thank a lot I don't know if I can ask you more I don't want monopiliser your time you must enlarge your account lol
but if i understood what does it mean "swing" when price move up or down and retrace ? you said try each 1% but for find your signicficant LH/LL HH/HL you can say " each price move and retrace at level ??? fibo retracement you can plot LH/LL HH/HL from high or low ? for find mechanical ?
Thank and sorry for my english
Regards
Ignored
I don't use fibs for this task. HL/HH and the opposite should only be used when price is trending. If price is not trending it's no point of using them. So if price is trending upward, only look for retracements to plot HH/HL. And remember that this is not a tradeable system, its simply a helping-tool to define a (potential) trend.
On posted chart I've tried to explain what I mean by swings.