|
Commercial Member
|
Joined Jul 2006
|2,566 Posts
Same here, you know if this don't go thru we are going to be looking at something like the 40's here soon. All they have to do is pass this thing thru with all kinds of stipulations and let the big boys pay the taxes. Make sure they watch these crooks like hawks and get rid of all this speculating. Then we will be OK.
Yea I was looking for a thread with emphasis on long term trade. I think people get their accounts burned sooner or later trading lower time frames. However in other to enable me learn from you and follow the thread like to know your trading methodology. Thanks
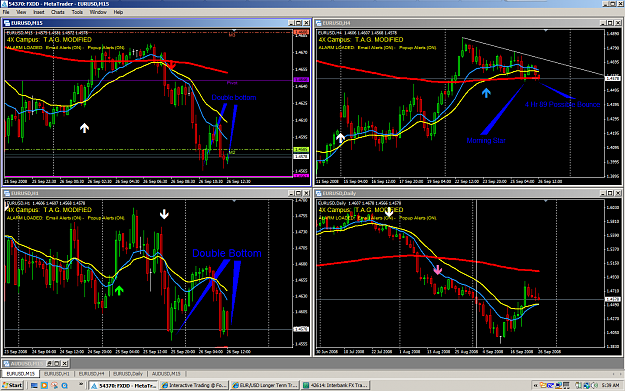
Notice how E/U is tied up around the 15 Min 89..... I stay out of crap like this.
Ignored
Hello, I am not a very experienced trader. I do know a bit about technical analysis, not much about candle stick charting. What I see on E/U charts and other charts which are looking similar is: Besides technical analysis,
process of making an inverted Head&Shoulder formation 4Hr chart. on flip side a huge cup which is makind a handle( if you are an Old Timer You will know what I mean)Now I think huge cup should have a huge handle as well.Price up to 1.40xx.Now having said that, at this price how many people will be screaming short selling like 1.36xx next or even 1.33xx.It will be a Bear trap, from there Elliots last wave will come into play. that can be on a long term
1.55xx- 1.58xx or even 1.61xx(will take a year or so)up to 100% retacement.
Now this will be backed by $700 bail out which will happen, currency will depreciate to bring foreign investors in to buy but not now, not till December,Us currency will peak whatever that be 110.60 or higher(Bull trap). Then a big fall probably be up to what we had in Mar/April '08(double bottom) then its gonna skyrocket.
Last of all I would say Big boys are not gonna do what is expected by 14% of the retailers but Opposite and will leave us to make sense out of it.
What makes perfect sense to me is allUP there AND thats my long term Bias. Think about it.....and let me know if I am wrong to think that way??? Thanks.
|
Commercial Member
|
Joined Jul 2006
|2,566 Posts
Right now we are testing the bottom of support we broke thru earlier today. We are still above the 100 & 200 SMA and a move down may be next to the red line which is a support along with the 200 SMA only if the resistance holds. Approx. 1.4540
Could anyone experienced with fundamentals say if this bailout is approved will this be dollar positive or negative ?
I would say it is very dollar negative but there was a dollar positive reaction when it first hit the news !
I think it increases the budget deficit, props up a bubble, causes inflation... all bad for the dollar, even a senator admitted that if the bailout goes through the dollar is toast.
So will we see an initial move up for the dollar as relief that the US financial system is saved and then steady dollar depreciation for months ?
What do you guys think ?
|
Commercial Member
|
Joined Jul 2006
|2,566 Posts
Hey all,
If this was a normal morning I would say the signs and signals are showing a bounce long here. The 89 SMA is supporting price right now and has formed a Morning Star a few candles back. The 1 Hr is showing a possible double bottom as is the 15 Min chart. The Daily is showing a slow descending set of spinners, ( All Red ) right at an 11/21 EMA cross. I would go up here on any other day. I have put a small order with a short stop. Be careful people. If they suddenly sign that stupid bail out we could shoot South in a hurry.
Hi Guys, I started this thread because I believe the wrong message is getting out in another thread. I understand that everyone has their own views and I respect that. But someone is going to get hurt. So I have created an alternative for more expierienced traders that we can control what is said and who stays and goes. And the young traders can learn from them. Just try to deal with traditional direction off the Daily and the 4 hr. Anyone is welcome, especially expierienced traders.
Jim
Ignored
LOL - glad to see that another trader using the same chart periods - analyse on the higher TFs and execute off the lower - and the 15m's fine for me.
I'll add this thread to my list - happy trading - well after Paulson & Co finally reach agreement - anyone for Sunday, whilst the markets are closed? http://forexfactory.com/images/icons/icon12.gif
My first post here, basically a test, but the chart might give someone some food for thought. Trying to predict the nearest few days is just about impossible given the current political situation around the "bailout"..
My first post here, basically a test, but the chart might give someone some food for thought. Trying to predict the nearest few days is just about impossible given the current political situation around the "bailout"..
As it helps me in my own trading, I'm putting down the present situation as I see it.
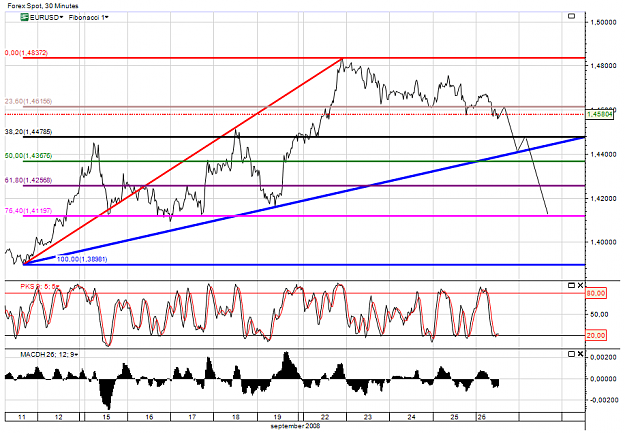
On the Daily chart, price has just turned down from ~90 pips under the strong rally up to the 50% retracement of its big July to September fall.
Looking at the 4 hr chart and applying the fibonnaci retracements to this 987 pip rally we find that the 38% is at 1.4490 and the 61.8% is at 1.4260.
Normally, IF this last rally is to continue, we would expect price to retrace into the 490 to 260 zone and then continue north - OK, these time are NOT normal, but that effects my trading and not this analysis.
After falling during yesterdays US session to the low at #1, price bounced up to retrace 38% of that fall at #2 and turned south again with the wide range red candle at the London Open. There was a higher low at #3 (note that this was with higher volume in a spinning top) but this move didnt go far and turned back at the opening level line.
Now there is another bounce up from #5. IF this continues up and passes todays high at #2 it will be a bullish sign, as price hasnt been able to get down to its 38% fibo. Time Will Tell - I guess in todays US session or later over the weekend. assuming that the politicos can reach an agreement...
but interpretation is different. If price does not break the 4482 support and utl stays valid, I'm expecting euro to hit 1.51xx, perhaps within a couple of weeks.
My first post here, basically a test, but the chart might give someone some food for thought. Trying to predict the nearest few days is just about impossible given the current political situation around the "bailout"..
As it helps me in my own trading, I'm putting down the present situation as I see it.
On the Daily chart, price has just turned down from ~90 pips under the strong rally up to the 50% retracement of its big July to September fall.
Looking at the 4 hr chart and applying the fibonnaci retracements to this 987 pip rally we find that the 38% is at 1.4490 and the 61.8% is at 1.4260.
Normally, IF this last rally is to continue, we would expect price to retrace into the 490 to 260 zone and then continue north - OK, these time are NOT normal, but that effects my trading and not this analysis.
After falling during yesterdays US session to the low at #1, price bounced up to retrace 38% of that fall at #2 and turned south again with the wide range red candle at the London Open. There was a higher low at #3 (note that this was with higher volume in a spinning top) but this move didnt go far and turned back at the opening level line.
Now there is another bounce up from #5. IF this continues up and passes todays high at #2 it will be a bullish sign, as price hasnt been able to get down to its 38% fibo. Time Will Tell - I guess in todays US session or later over the weekend. assuming that the politicos can reach an agreement...