the best and safest way to scalp, take a look at the 3 chart below i have posted the 1 5 and 15 min charts i have marked out what your entry would be, it makes a big difference if you have enough screens with this method to look at all time frames,
firstly if price has bounced off support or resistance levels in this case S1 watch for the point price goes above all 3 gann lines in this case sometimes 2 is enough 1 and 5 min , at the same time all the lags start to move up
Here entry would be at 1.8312 so far it has hit 1.8350 with your trade not going against you apart from the spread
Ignored
+++++++++++++++++++++++++++++++++++++++++++++++++++++++++++++++++++++++++++++
Yas
you are doing a great job here - thanks.
Mind a few questions? Since I'm totally unfamiliar with candlestick signals (like DOJI etc.)I rather stick to the other technicals.
Where do the arrows in your top pane refer to?
In the same frame you show in the upper right corner 3 indicators in various time frames. How useful are they and which denotation have informations such as "pips to open" + "daily av."?
You have been referring to the relation of the 2 Laguerres. Care to explain this a bit more in detail?
Would be generally very interesting to know which indicators have been showing the best results with regard to the time frames you watch!!
The lower pane shows a histogram besides the Laguerres. Where does this refer to - I'm not sure about that?
BTW on my screens a WHITE background of the charts would probably make it easier to recognize the various indicators.
Would you give it a try?
Two shorts today, exits were a bit late. Should have exite during those dojis on 5 min charts. Entry and exits are marked on red lines.
Ignored
+++++++++++++++++++++++++++++++++++++++++++++++++++++++++++++++++++++++++
Kristjan
the indicator "QQE" is new to me. May have missed its description somewhere.
How useful is it actually (and in which timeframes) and are there parameters for this indicator in order to vary its settings?
+++++++++++++++++++++++++++++++++++++++++++++++++++++++++++++++++++++++++++++
Yas
you are doing a great job here - thanks.
Mind a few questions? Since I'm totally unfamiliar with candlestick signals (like DOJI etc.)I rather stick to the other technicals.
Where do the arrows in your top pane refer to?
In the same frame you show in the upper right corner 3 indicators in various time frames. How useful are they and which denotation have informations such as "pips to open" + "daily av."?
You have been referring to the relation of the 2 Laguerres. Care to explain this a bit more in detail?
Would be generally very interesting to know which indicators have been showing the best results with regard to the time frames you watch!!
The lower pane shows a histogram besides the Laguerres. Where does this refer to - I'm not sure about that?
BTW on my screens a WHITE background of the charts would probably make it easier to recognize the various indicators.
Would you give it a try?
Thanks for taking your time.
Ch.
Ignored
Hi Charles
the arrows on my charts i use as a guide for direction , one is the chandra sas5 which are given when there is a macd cross, the other is the xpma with t3 that you can find here on FF.
the top right hand corner is the signal bars, i use them as a visual guide, average movement etc
Understanding the lags and how they work accross the time frames plays a big part in this system, and how to use them with the emas as i explained in the 1st post
i watch all timeframes upto 4hrs , and generally look to take trades in the direction of the 4hr/daily charts using the 1 and 5 min to enter
i use black as a background as i find it easier on the eyes when looking at alot of screens for long periods
if there is anything you would like me to emphasise on please let me know i will try to explain, i am not around much this month so will try to answer asap
|
Joined Jan 2008
|
Status: Pip Collector
|64 Posts
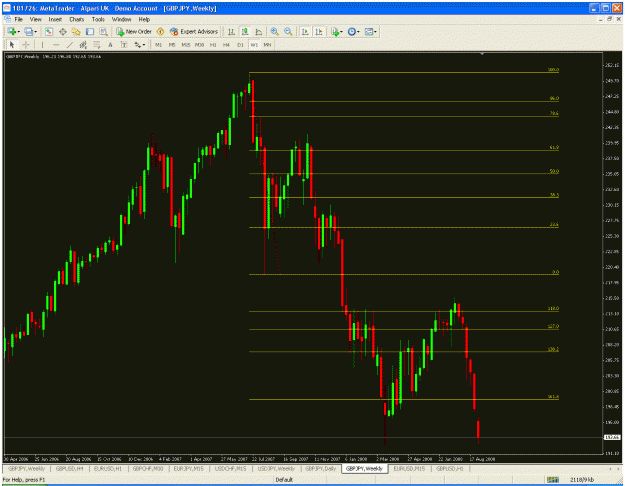
1st chart is the weekly as disscussed in the room , you can see we had the 61.8 retracement and it hit the target of 161.8
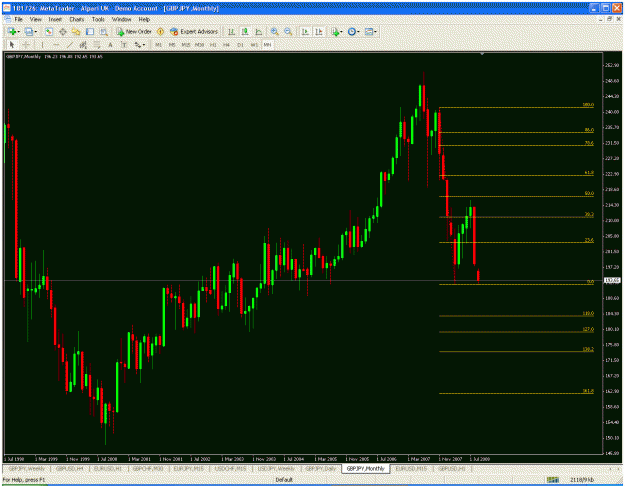
on the second chart is the monthly chart which we got a 50% retracement now target for this is at 161.8 ext which is aroud 163 mark over the next few months
if you look at the lags you will see on the weekly the red lag looks good to turn at the 0.45 level and on the monthly has further to fall so let your profits run and trade in the direction of the higher tfs use the 4hr to catch the top of a new leg down
Thank you for the system I read them all & I think it's a great system.
I've seen arrows up & down in blue green & red in your charts. What are they? - audio alert! ?
if it's possible could you please post it to us and some explanation would be good because I couldn't find in the lists of your EAs
one more question - Do we have to spot doji hammer or any reversal pattern on 6 pairs on 1 hr tf first before we look into 30,15,5 & 1min tf ? And it would be good if we have EA to screen on reversal patterns
I use the QQE as extra confirmation and it is not a MUST to have thing it more a nice to have indicator. I look QQE cross and the setting is 60 for smoothing. For me it is working out nicely so am happy.
+++++++++++++++++++++++++++++++++++++++++++++++++++++++++++++++++++++++++
Kristjan
the indicator "QQE" is new to me. May have missed its description somewhere.
How useful is it actually (and in which timeframes) and are there parameters for this indicator in order to vary its settings?
Thank you for the system I read them all & I think it's a great system.
I've seen arrows up & down in blue green & red in your charts. What are they? - audio alert! ?
if it's possible could you please post it to us and some explanation would be good because I couldn't find in the lists of your EAs
one more question - Do we have to spot doji hammer or any reversal pattern on 6 pairs on 1 hr tf first before we look into 30,15,5 & 1min tf ? And it would be good if we have EA to screen on reversal patterns
Thanks - pete
Ignored
Hi Pete
there are 2 indicators that i use that give arrows xpma and chandras sas5 i have attached them , i use them as a visual confirmation ie if they are in line with my trade direction the better
yas
ps , dont forget to upload the tema for the xpma to work
there are 2 indicators that i use that give arrows xpma and chandras sas5 i have attached them , i use them as a visual confirmation ie if they are in line with my trade direction the better
yas
ps , dont forget to upload the tema for the xpma to work
|
Joined Jul 2006
|
Status: Confluence of events , S/R , Trend
|140 Posts
Thanks for shareing Yas ! will I get the multitimeframe indicator and the big price quote numbers in your templet or do i need anouther indicator .I have trouble seeing those small numbers on my meta platform .Could you post it please if its not in the templet . Thanks ! Tom
Thanks for shareing Yas ! will I get the multitimeframe indicator and the big price quote numbers in your templet or do i need anouther indicator .I have trouble seeing those small numbers on my meta platform .Could you post it please if its not in the templet . Thanks ! Tom
Ignored
Hi Tom
you can download the indicator its on post 8 "signal bars"
thanks for sharing you system. I have a few questions:
In your indicators there's one called Gann Hilo Activator, can you explain its use?
Thank you
Celext
Ignored
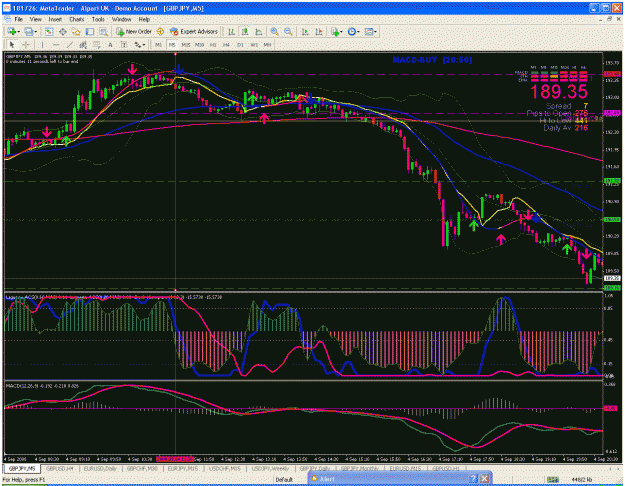
Hi celext
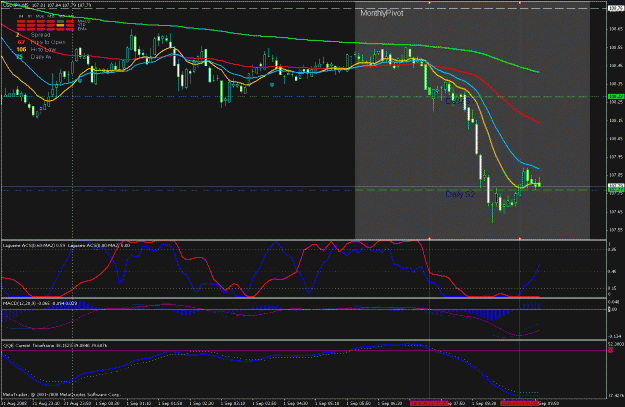
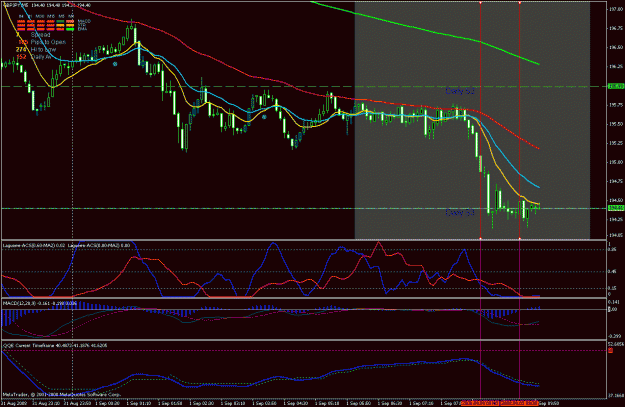
i use the gann line its the yellow line on my charts inline with the other indicators , how i use it when the price is above the line its a buy and when below its a sell , il post a example below iv drawn a vertical line where the sell came in , notice how the candle closes below the gann line and the lags , histogram line up for the sell
there are 2 indicators that i use that give arrows xpma and chandras sas5 i have attached them , i use them as a visual confirmation ie if they are in line with my trade direction the better
ps , dont forget to upload the tema for the xpma to work
Ignored
Thank you yas,
but I can't get audio alert so I don't have to watch screen all the time. how do you set inputs for chandra-sas5,xpma & t3ma?
Hi Yas, thanks for your efferts.
Will you please explain with an example whare to put the SL? ( it is not clear from the charts posted by you)
Also can you explain how to apply this system for down market( short trade)
Thanks in advance