DislikedAlright, understood mate. As i was reading thru your thread i noticed that you prefer wait for the pullback after the tl break and only then enter the trade, correct?Ignored
I'm eager to launch a new thread with a much better describing on how to draw TL and how to benefit from trends. This thread as a bit out of context compared with the start of it. I don't draw lines according to post #1 any more. But I guess everyone is aware of that
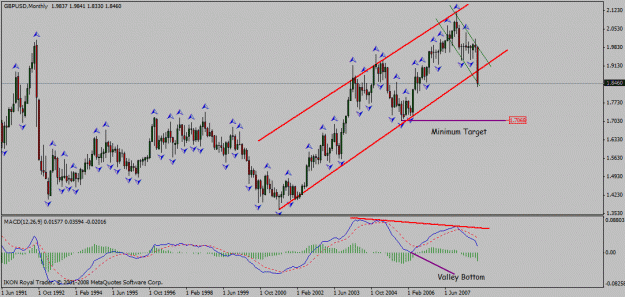
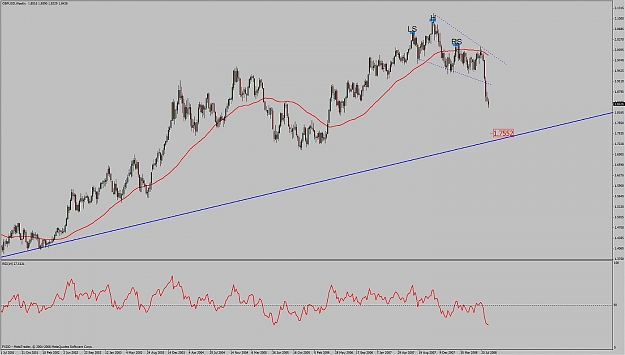
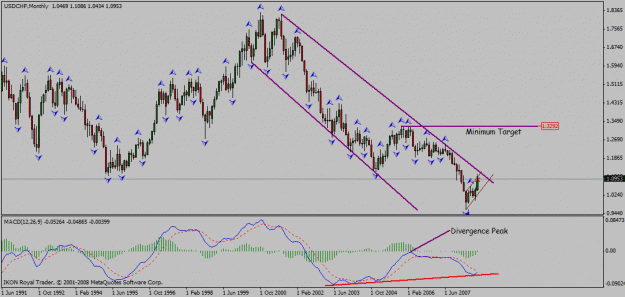
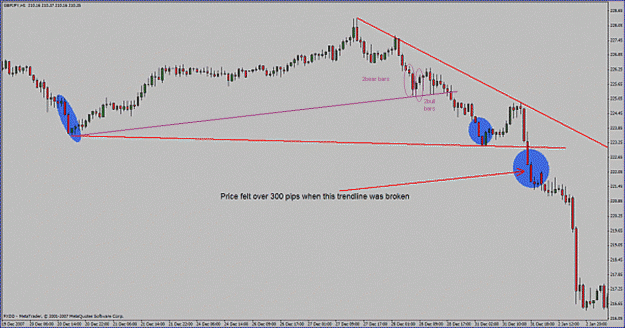
I've been posting charts, almost from the start of this thread, with LH/LL etc. to define trends. This have been a easy way to measure a trend for me. When I read Brian Marber's book regarding TA, the "last" puzzle felt in when I saw he did pretty much the same, only that he also draw TL from these points, and have been doing so for 50+ years! When the new thread is launched, I'll give a full explanation on how to draw them. It's quite easy and logical.
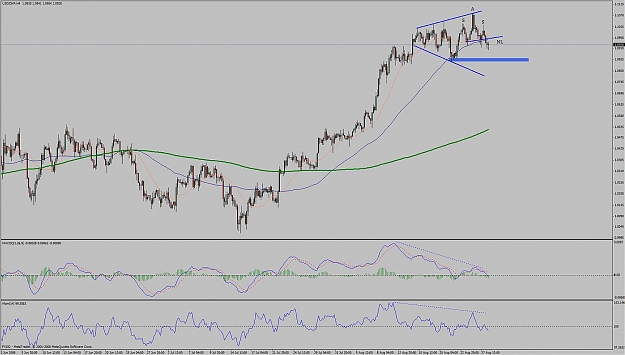
Not only that, but during my little research, I also found out that different type of candlesticks (more known as price-action here on FF) seemed to increase the probability for price-patterns. I hit my head hard when I realized this was nothing new, of course, I just hadn't studied candlesticks good enough in the first place.
From this I learned;
Its not about inventing the wheel all over again. Most "methods" have been invented, its more about to fit any particular method to you, one that fits you(re personality) and along with that the discipline/confidence to follow it, which takes A LOT of practice and time.
Measure twice, cut once