I don't know where you can find competent Gann tools for MT. I've built my own. If there's enough interest I could open a thread about my findings of Gann cycles inside currencies.
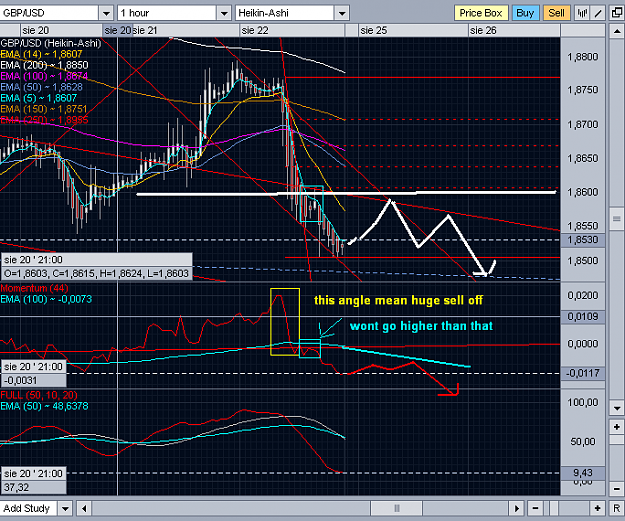
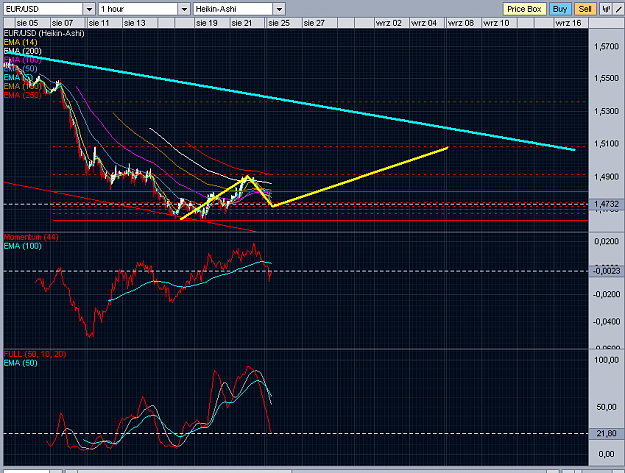
That's what I am expecting too! The break of the H4 trendline would confirm the beginning of the wave down imo.
P.S. Will open a thread about cycles later today.
Ignored
Why do u think that eur/chf goin to drop from this level ?
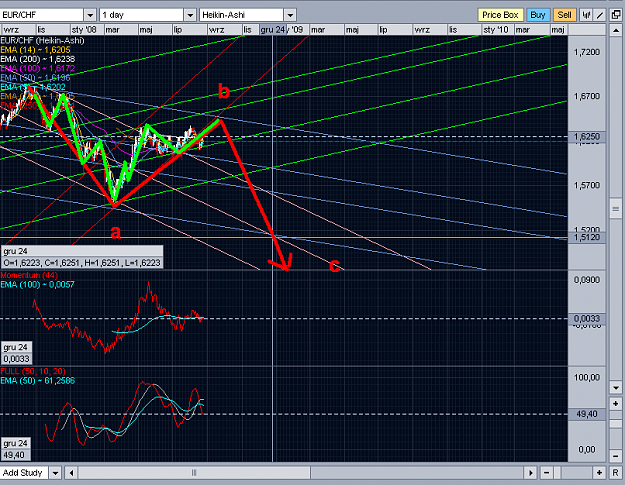
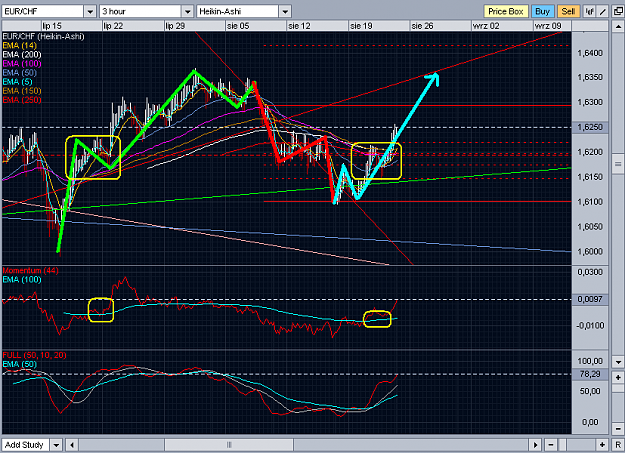
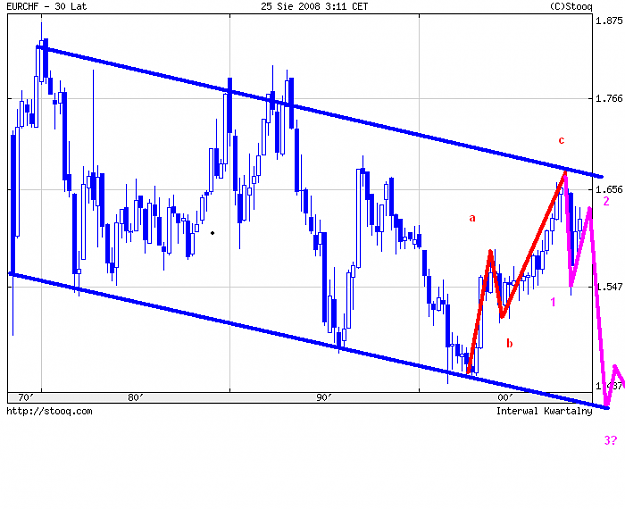
Becuase from my point of view price is very bullish at 3H and daily chart.
Momentum and stochastic is positive and we have 10 bullish candles in a row(3H). and 3 in row at daily.
Price gonna accelerate more b4 major drop IMO.
I am glad that my chart could be usefull for some1
im not 99% sure of this scenario but 75% could be
gru24 mean december 24th
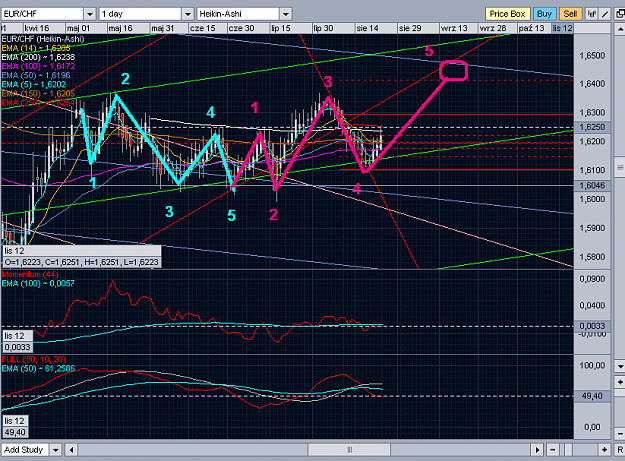
I will start to short near 164 from aprox 14th of september .
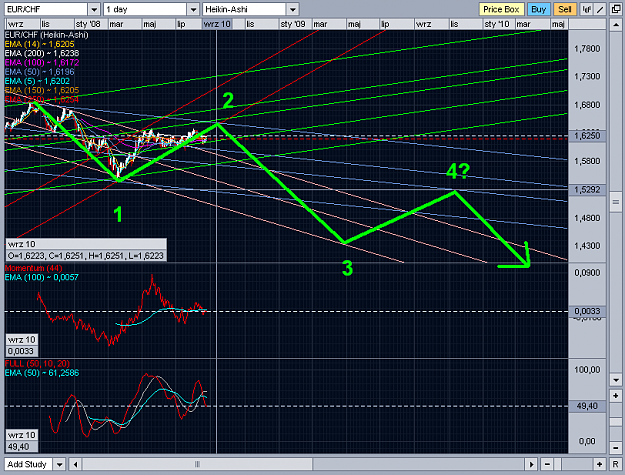
personally prefer second chart
Ignored
I am not sure what all those lines on your chart are nor what those squiggly lines at the bottom represent but those are not needed nor are they part of any elliot wave counts, how can you possible count waves in that mess when you can even see the chart? you post a possible 123 count that has nothing to do with EW's and show no wave counts at all.
please tell us what books you have read and studied on EW's that led you to this post?
EW's do not use indicators of anykind and sorry but that is nothing but a big mess nothing to do with EW's at all
Don't chase the market, Let the market come to you
I am not sure what all those lines on your chart are nor what those squiggly lines at the bottom represent but those are not needed nor are they part of any elliot wave counts, how can you possible count waves in that mess when you can even see the chart? you post a possible 123 count that has nothing to do with EW's and show no wave counts at all.
please tell us what books you have read and studied on EW's that led you to this post?
EW's do not use indicators of anykind and sorry but that is nothing but a big mess nothing to do with EW's at all
Ignored
Dont worry i see my chart very clearly.
These line are very usefull if u know what they represent.
Do not focus on these lines anymore.
For many ppl mess is called harmony and vice versa.
Relativity theory u heard about it im sure.
I do not need any book to be successfull trader.
Please be more precise in the future im not a seer which chart do u mean?
I posted 3th of them where is 12345 count.
Also please present ur wave count where will be price in the future.
Just draw only one wave.
Lets see
beside i add to EW other compound like momentum to be SURE if next wave will be extended or not.
Added
Hmm i remember u now from eu thread...
Do u wanna say more or ..
I am not sure what all those lines on your chart are nor what those squiggly lines at the bottom represent but those are not needed nor are they part of any elliot wave counts, how can you possible count waves in that mess when you can even see the chart? you post a possible 123 count that has nothing to do with EW's and show no wave counts at all.
please tell us what books you have read and studied on EW's that led you to this post?
EW's do not use indicators of anykind and sorry but that is nothing but a big mess nothing to do with EW's at all
Why do u think that eur/chf goin to drop from this level ?
Becuase from my point of view price is very bullish at 3H and daily chart.
Ignored
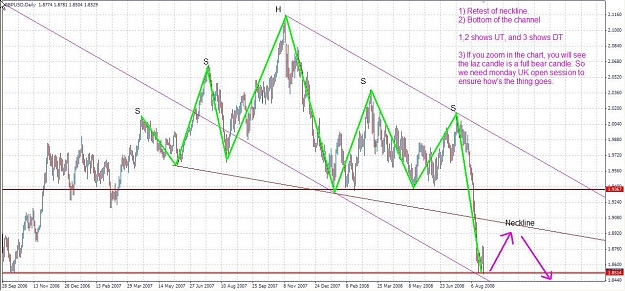
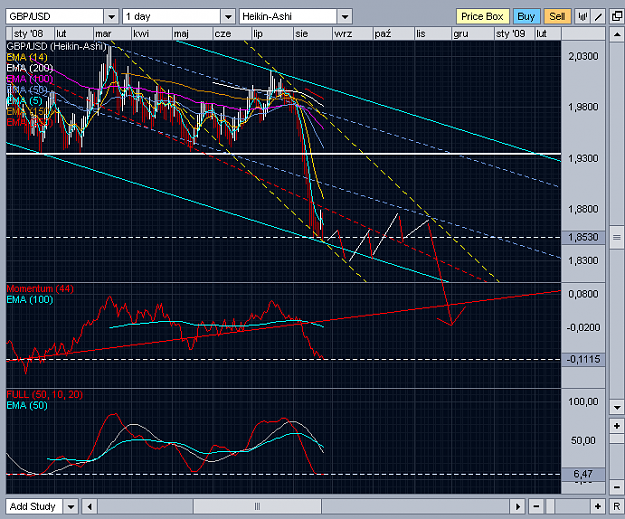
There was a debate on another EW forum regarding this, I'll stick to my count for now the main reason is because the last rally on Daily was corrective in nature (see chart) meaning that it wasn't an impulse therefore lower prices are a high probability.
On the other hand the main count on Daily is bullish impulsive imo, but as I said I expect more correction/consolidation before going up again. I could be proved wrong, no problem I'll re-count my waves then.
This is the roadmap, trading is a completely diffrent issue, that's why you'll see many EW analysis chaning minds very often in the same time they are not trading but trying to "feel" the waves until they have a setup to position on the most probable scenario.