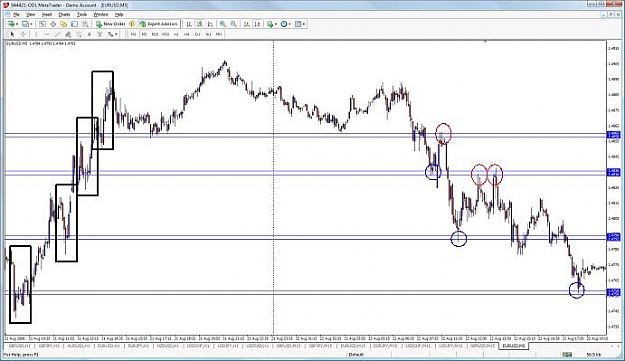
DislikedHere's a pattern that happens all the time and is very important for taking advantage of a lot of buying and selling opportunities. You'll notice that when price makes a "U" formation at a turning point there will commonly be a base built within it. Think of it as a cup, where the bottom inside the cup acts as a potential turning point for price. To make the most out of these you would want to scale down to smaller timeframes in order to pinpoint the exact bottom of the cup formation.
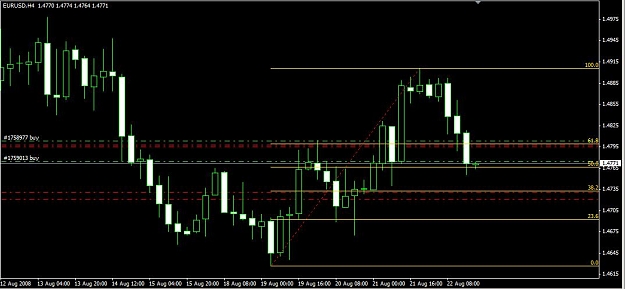
If the base of this cup lines up with historical support or resistance all the better. Many times you will see the "stabby" bars in trends get nulled and price will turn at these bases. It happened today on EUR, for instance.
If you take a look at your charts you're going to find them everywhere. They happen over and over again; I look at them very frequently.
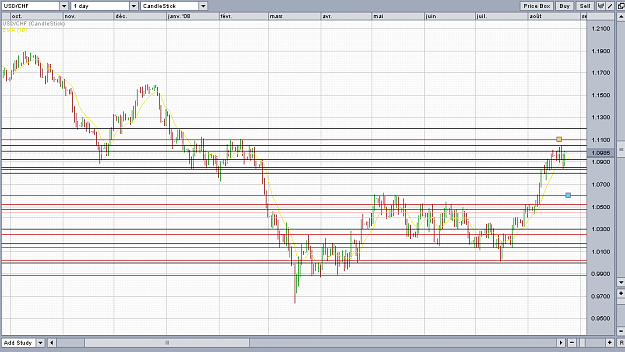
Below are some recent examples on EUR and GBP.Ignored
I've always wanted to move down to lower timeframes as the market seems to be dead a lot when trading higher timeframes like I do. I'm basicaly looking to grab 10 - 30 pips a trade, a few times a day and this strategy might just do it