Here is some explanation I could find... anyway... I am gonna stay away from this Broker because my trust already gone. Just entering the Forex Competition with small capital. With Big Capital... I gonna choose other broker.
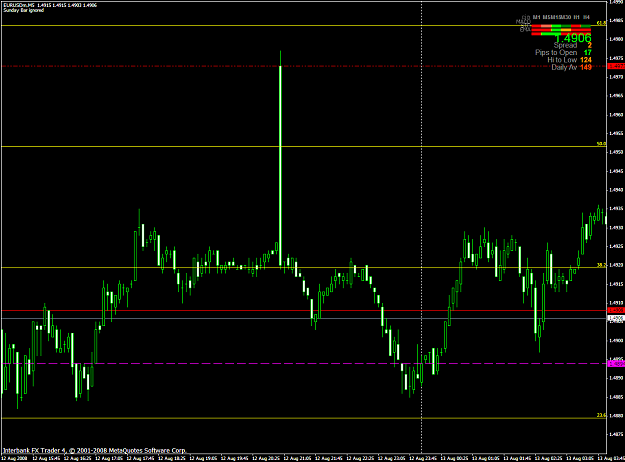
If you were affected on a live account my sincere apologies for my earlier comment. However, I think I can shed some light on the spike that you saw.
Every retail broker has to build some sort of pricing feed into their platforms, either a bank feed or another Market Makers feed. Where some brokers get a price feed can be anyones guess. However, if they are NFA regulated you can bet they are using a legit feed, i.e. a bank feed, another Market Makers feed or an ECN feed. Also, remember that the feed that is shown to you is the Market Makers feed and generally Market Makers only use that feed to show the end client a price. (meaning they book the trade) When they want to offset some risk they would do so with one of their liquidity providers.
Most Market Makers and ECN's now have multiple banks that they do business with and get liquidity from. However, if you are not seeing a variable spread with very low spreads you are probably not benefiting from that aggregated feed. Meaning that they use that feed to lower the Company's spread (the spread they can deal off of) and not the end clients spread. More than likely, a company like this is pumping their price feed with one bank or Market Maker and then marking up that spread for their clients to deal off of. Depending on the Market Maker they might be pumping in an aggregrated feed into the platform and then marking up that spread.
Regardless of how they do it, if one bank has a bad tick (which is a technical glitch generally resulting when the price being sent from that bank is way off market due to that banks technology not calculating prices correctly), then it shows up on your charts or platform as a huge spike. A lot of the times if you are not carefully looking at the price on the platform you would never notice the spike because it happens so fast. Instead you only notice it later on the chart.
Most retail brokers set up fail safes that will not allow any trades to get executed when a pair gaps an unimaginable amount in a matter of seconds. It can generally be discovered because the price gaps down very quickly but then the next tick is no where near that price. This is different then a gap that occurs around news because once the price gaps, the next tick will be close to the original gap. However, since charting is generally offered by a third party (for example say, Broker A uses Intellichart for their charting service, then Broker A gives their pricing feed to Intellichart and then Intellichart uses that feed for Broker A's charts) so that spike shows up on the chart even though you would not have been executed.
The spike you saw could have also been a legit spike as well. Since Saxo didnt show that same spike a couple of different scenarios are possible. One, they are not using the bank that gave the price spike. Two, and more likely their feed is aggregated and that spike was not shown because their was better pricing in the market. If it was not a legit price spike and they were using the same bank that gave the false spike they probably have a charting package where they have built in a fail safe that doesnt show bad ticks. I dont know if Saxo uses a third party for charting or if they do it in house.
It is important to remember, with NFA regulation tightening, the price that a client is offered has to be considered a reasonable price. Meaning that you cant get filled at 1.5600 for EUR in a non volatile market when every other Market Maker is offering 1.5700 (including banks and other Market Makers). However, as you can imagine this kind of terrible fill would be hard for us to get any kind of due compensation and it would be a pain for us to go through the process of NFA Arbitration.
Any CS on top of the Peak with long Shadow upward being followed by Bearish CS ... I consider as SHOOTING STAR. Psychologically... the top has been reached and strong price rejection to go up higher whereby more eager SELLERS are active. REVERSAL SIGNAL... to go down.
You can turn the CS upside down... meaning long shadow downward followed by bullish CS at the bottom of a down trend movement. That signalling Bottom has been met and eager Buyers are active. REVERSAL SIGNAL... to go up.
Ignored
Thnx for the knowledge sifu... ...really appreciate it
Many is making money ya.. Good2.. Have a great conversation inside, dont fight2 ok.. Sham, possibly i wanna join the tournament next month.. I just wanna test my skills and capability.. Bdw apies, seeing your shooting star, i can take is as prematurely shooting star and sometimes it wasnt really working like you get today. Bdw, you can take it as incapability for price to break the daily PB level so entry from SFB is preffered. Great job buddy!
Ignored
Thnks bro... this is what i want... you give me an additional knowldge and advice...still need more study to make money,heheh... BTW, really appreciate it bro...
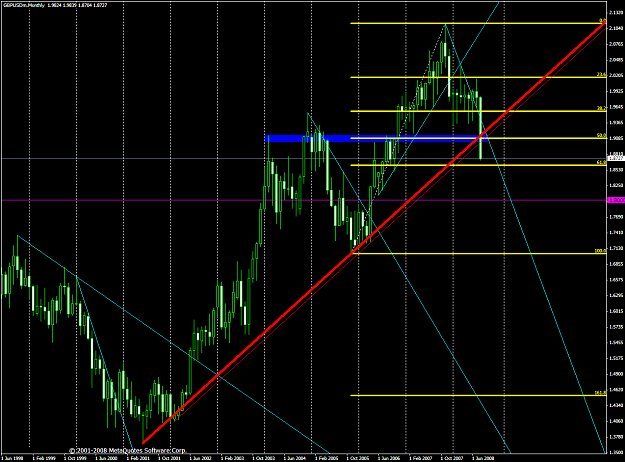
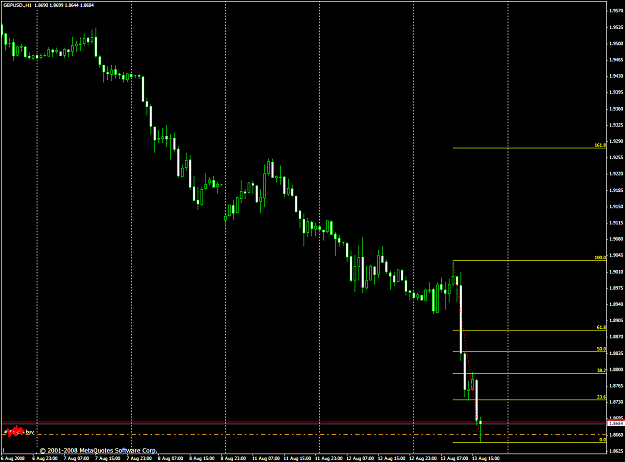
Easily breaking Critical Support around 50% Median area... already nullify that Monthly UP Trend line. Can that 61.8% Fibbo Retracement halt the raging BEAR?Maybe for temporary only. I see 1.9800 or even 100% Retracement in the near future.
sorry noob here
but i want to ask some newbie question, pls dont flame ok
bout the shooting star and hammer
which one has the dark body, or both can be dark or bright, the difference just the shadow:nerd:
Ignored
The way I see it... doesn't matter if it black or white... as long as the shadow is Long Upward being followed by bearish CS... or not so strong Bull CS. That's the way I see it... other traders might see it different ways.
The way I see it... doesn't matter if it black or white... as long as the shadow is Long Upward being followed by bearish CS... or not so strong Bull CS. That's the way I see it... other traders might see it different ways.
Ignored
oh is it
i think ur opinion might true
bcos i been searching on this forum bout this two signal
some refer to dark body and some refer to bright body, i'm confuse
now u had told me so it clears my head la
thanks
by the way, anyone had any idea regarding the usdcad strength