Okay, Jairo ... Here's those charts of E/U in 2002.
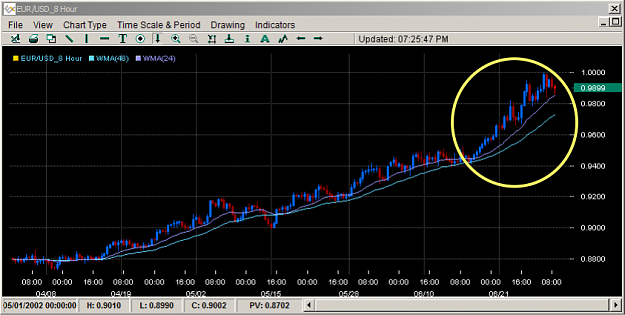
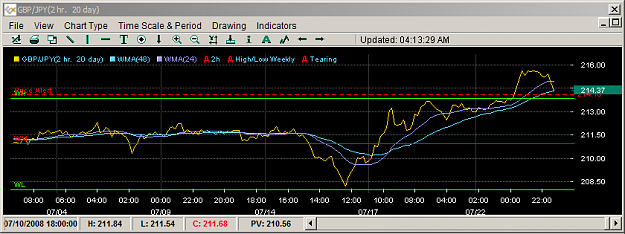
The first image shows the overall tidal wave in an 8h chart, so we can see the whole picture.
Now, there are many places within that tidal wave where the PA would have undoubtably met the criteria of my "Tearing" signal/alert. There were many places where pullbacks occurred 100 pips, so could safely rescue.
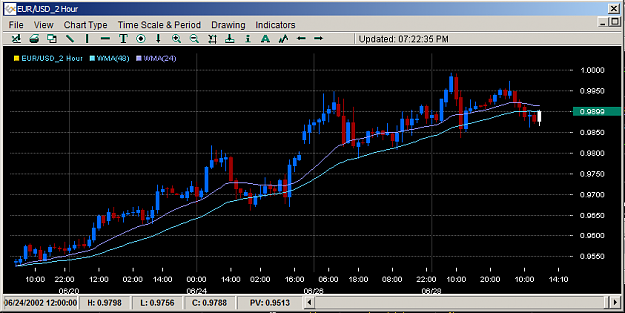
The circled area is where there looked like a no-breather, lol, so I took a screenshot of that area in a 2hr chart to zoom in on it (the 2nd image).
On the 2h, there are several instances where the PA went up 200 - 300 pips, but there were definitely places in which to conduct rescue, cuz some of those would most certainly have met the "Tearing" criteria (as they had retracements of 50 - 150 pips).
.
The first image shows the overall tidal wave in an 8h chart, so we can see the whole picture.
Now, there are many places within that tidal wave where the PA would have undoubtably met the criteria of my "Tearing" signal/alert. There were many places where pullbacks occurred 100 pips, so could safely rescue.
The circled area is where there looked like a no-breather, lol, so I took a screenshot of that area in a 2hr chart to zoom in on it (the 2nd image).
On the 2h, there are several instances where the PA went up 200 - 300 pips, but there were definitely places in which to conduct rescue, cuz some of those would most certainly have met the "Tearing" criteria (as they had retracements of 50 - 150 pips).
.
Attached Image(s) (click to enlarge)