DislikedGreat thread!
I'm still not done reading through all of it but I really like what I've read so far. I think I'm convinced about ditching the indicators.Ignored
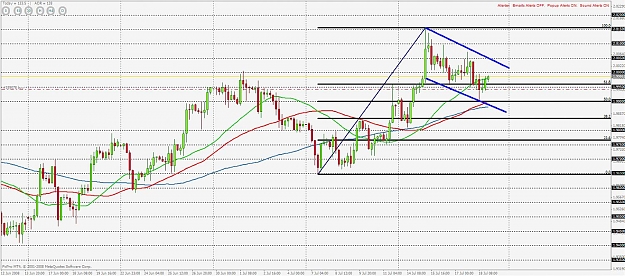
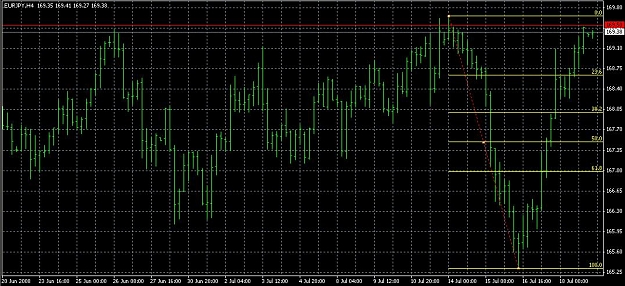
You will find (if you haven't already) that we us horizontal support and resistance, diagonal trendlines (drawn on 4hr or greater only) and Fibs (again drawn on 4 hr or greater only. I look for the last wave that is opposite direction of the current trend on 4 hr)
Candle formation patterns, such as triangles, wedges, island reversals and flags, are treated like warning signs on a highway. (when you see a sign that indicates there is a stop sign ahead, do you slam on your brakes or do you prepare accordingly?)
Support and resistance trump EVERYTHING. I only give weight to a fib level or a diagonal trendline when they line up with a major S&R level.
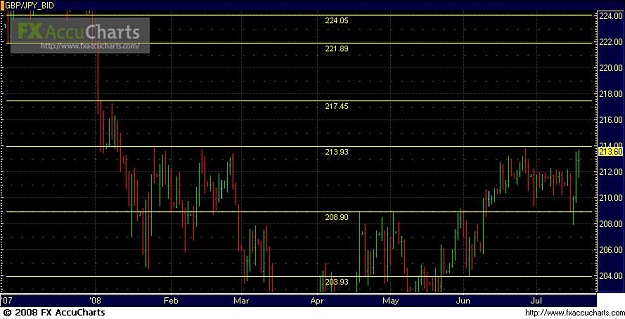
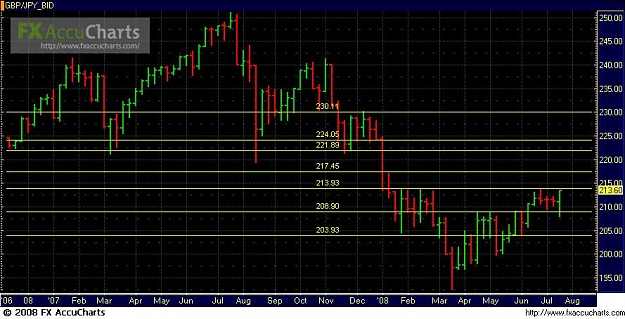
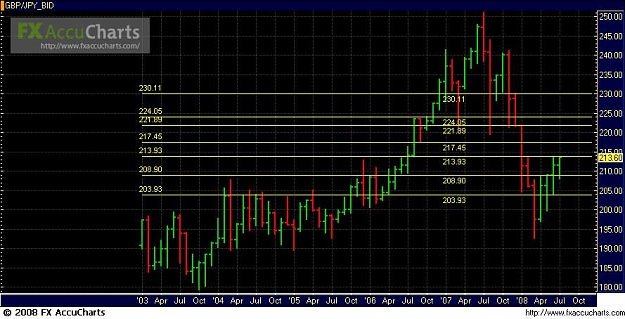
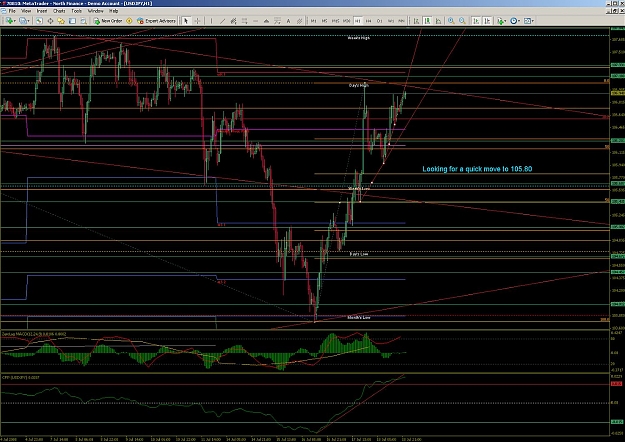
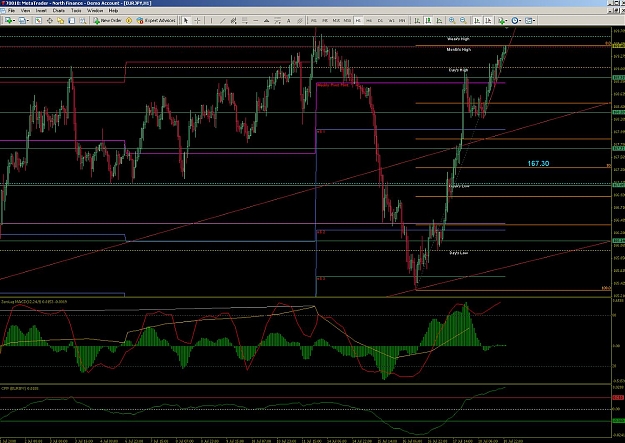
1 Hour charts are usually what I trade from and are very good for finding reversals in the market. My analysis starts at the monthly and comes down to the 4 hour. The good news is once you identify S&R levels on the monthly, weekly and even daily, they will be there for along time. Then the majority of your work is on 4hour. (trust me, a 30 year high last week will be a 30 year high next week in most cases) A 25 year level on the Aussie was blown out finally in the last couple weeks. A thirty year low was taken out on the USDCAD last year. Within your first month of analysis you should have descent levels from your 4 hour where even then your analysis requires less time. This is a system where a lot of work in the first few weeks will pay off well for along time with only routine maintenance to keep you running.
I realize if I wanted to sell you a system or charge some huge mentoring fee then I would have to really complicate the issue and build on the fear of losing money, but quite honestly I would just rather see you do well for yourself. Perhaps a quote from that great trainer, Yoda, is appropriate. " There is no try. There is only do."
Energy and persistence conquer all things! Ben Franklin