USD/JPY touched the first BB resistance line on my charts today, so it may be lining up as a potential buy also.
Ignored
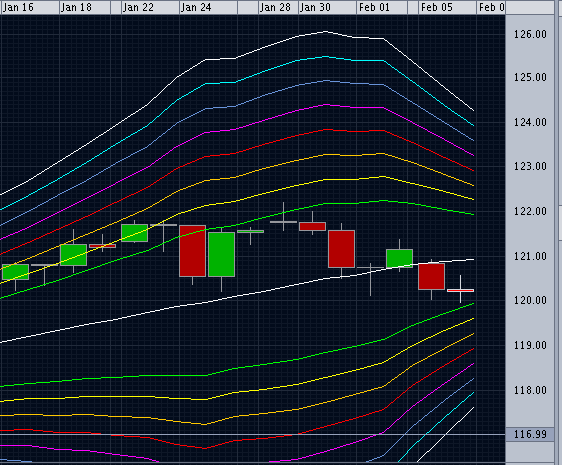
Sounds good. USD/JPY bar didn't touch my BB so i will stay out of it most likely. I still think we should all just use our own data and as long as it applies to the system, take the trade. Here's my graph:
Did anybody have long trigger with 2 lots for the above, at today's open?
Ignored
My GBP/USD is far from an entry signal. Here's my chart. If you post a pic of yours, I could say whether or not you should be in or not. Good to see ya again howard!
Does the method says you should wait for bullish bar to enter long when price close within the channel? I looked at you pdf's - it seems you always enter long on bullish (green) bar and short on bearish (red) bar.
For example yesterday's bar on cable bounced from resistance and closed within the channel, but it's bearish. Should someone wait for bullish bar close first before entering the trade?
Thanks,
denonline
Ignored
The color of the bar makes no difference. If a bar hits the resistances and then closes in the main channel, all in the same day, then that is an entry. But I'm confused by you guys saying entry in cable.... Can you post a chart please?
sure, here it is. I'm wondering why our charts are so different. I'm using IBFX.
Ignored
Ahh yes you should have definitely bought at the close of yesterday. As you can see, you would have made some good pips at the SMA. I consider buying now riskier, and if you really have that urge to buy, buy only 1 lot which will be sold at the top of the channel. Good luck,
My GBP/USD is far from an entry signal. Here's my chart. If you post a pic of yours, I could say whether or not you should be in or not. Good to see ya again howard!
Ignored
Thanks Kevin, I have been following your threads all the way.
The problem lies with weekend bar, I checked my other platform which does not have any sunday bar, it is exactly as yours, no trigger; on the platform with weekend bar, the price has pierced the green band and closed inside the center area which triggers a long on today's open.
Ignored
Aha! Well, there you have it.. Thanks Howard.
I think those of you that follow my threads know my opinion about weekend bars, but I'll just explain to those that don't already know: I don't use weekend bars! Personal choice, and you are welcome to do what you want, just understand that our results will be different.
Well I'm off to work now, so feel free to leave a question, but chances are I won't answer it until 4:30 CST
|
Joined Dec 2006
|
Status: AKA "Yen"
|1,654 Posts
Stopped out on 2 trades today:
USD/CHF -95 pips
NZD/JPY -77 pips
I probably entered USD/CHF a day late. If I had entered on 2/1 instead of 2/2, I would be down around 35 pips right now, but the trade would still be active.
Two trades are still active:
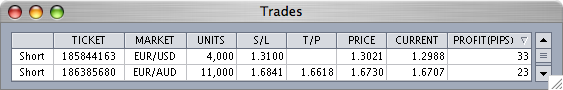
EUR/AUD--Currently up 27 pips
EUR/CHF--Currently up 69 pips
I entered EUR/CHF late. If I entered at the signal, the trade would be up around 120 pips.
Would you consider this setup as ENTRY?
It's my EURJPY chart.
Ignored
Thomass,
All of us seem to have slightly different closing times for the daily candle, which means your resistance lines may vary from mine slightly, but EUR/JPY just missed touching the resistance bar on 2 chart servers that I use, so it would not be a trade signal yet (at least for me).
Kevin may have a different opinion when he checks in.
Ignored
Hey thomas,
I'm going to have to agree with Yen on this one. It appears that even from your charts that it is BARELY touching if even touching at all. You could take it, but if I were you I'd wait for something a bit more definitive.
And Yen, thanks for posting your trades. I also got stopped out of USD/CHF.
Liquidate 1 lot USD/CHF
Date: 2/6/07
Price: 1.2394
Lots: 1
Reason:
S/L hit
Joined Dec 2006
|
Status: call me Kevin
|1,263 Posts
Alright Guys,
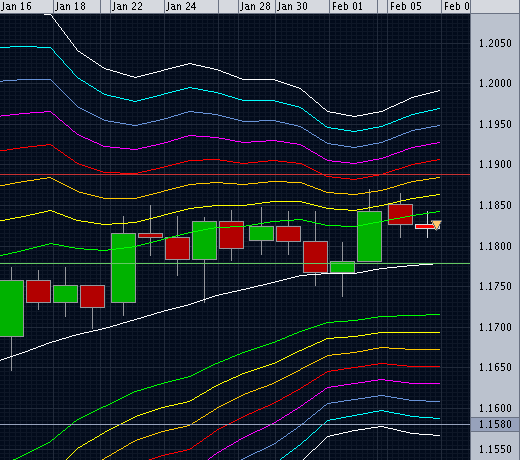
I have entered Short USD/CAD. By my charts, I should have entered yesterday, but given the little movement of today, I have decided enter short.
Trade #4
Short USD/CAD
Date: 2/6/07
Price: 1.1819
Lots: 1
Reason:
Price closed in main channel yesterday, and I should have entered. Today moved only 5 pips down, so I took the trade anyway. SMA is sloping up so I will enter with only 1 lot. And S/L will be set to 69 pips(what my ATR is reading) My T/P is set at 1.1778 (where the SMA is), and we'll just have to see what happens!
Good luck to all,
Kevin
PS will try to get a chart up for you within the next hour or two
|
Joined Dec 2006
|
Status: AKA "Yen"
|1,654 Posts
2/6/07
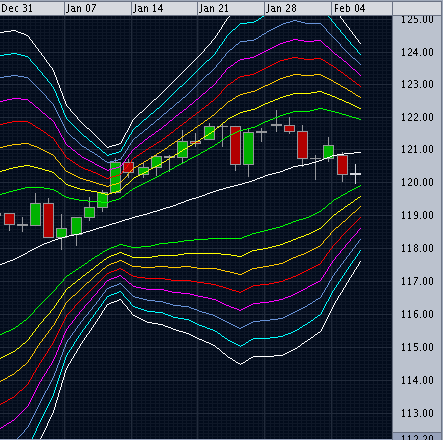
Long on USD/JPY @ 120.18
2 Lots
Price hit the BB resistance line today and closed above, triggering a long signal. Stop loss is 74 pips. Lot 1 target price is at 120.90 (SMA).
Please note: I think Kevin mentioned that the candle did NOT penetrate the resistance line on his charts, so you may want to check your individual charts.
It appears we will have these anomalies due to varying closing times with chart servers, but I decided to take the signals as they come.
2/6/07
Long on USD/JPY @ 120.18
2 Lots
Price hit the BB resistance line today and closed above, triggering a long signal.
Please note: I think Kevin mentioned that the candle did NOT penetrate the resistance line on his charts, so you may want to check your individual charts.
It appears we will have these anomalies due to varying closing times with chart servers, but I decided to take the signals as they come.
Ignored
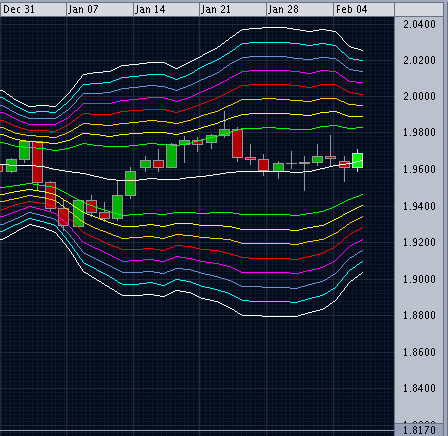
Yeah, it's not touching on my graph. I think it is best that we all use our own graphs, that we we have more chance of succeeding collectively! I have attached my chart of USD/JPY, and please see the chart above for my recent USD/CAD trade.
Yeah, it's not touching on my graph. I think it is best that we all use our own graphs, that we we have more chance of succeeding collectively! I have attached my chart of USD/JPY, and please see the chart above for my recent USD/CAD trade.
Thanks,
Kevin
Ignored
Hi Kevin
It may be that Oanda's charting is not calculating the bands correctly, while Oanda is a very good broker as compared to some others, their charting package is pathetic.
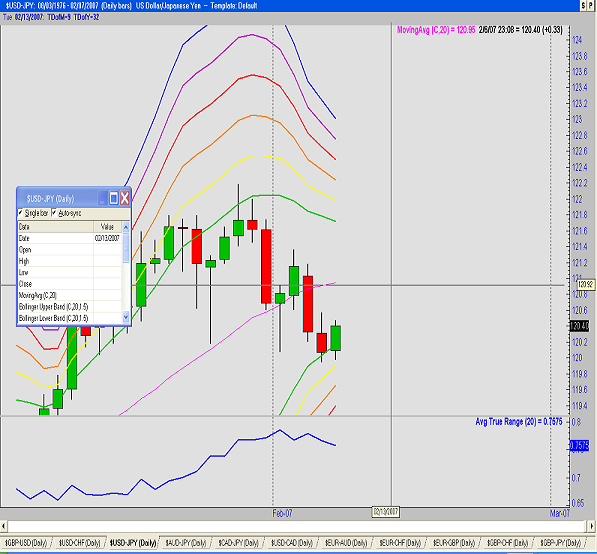
I have checked several charts and I see a clear buy trigger on USD/JPY on all of them at today's open around 120.10.
How do you feel about using MT4 charts with no sunday bar for signals and putting your trades on Oanda? I know a lot of traders use MT4 charts and other brokers for trades, including myself.
This way we will have more harmonious trades. Of course this is only my opinion, it is all up to you
It may be that Oanda's charting is not calculating the bands correctly, while Oanda is a very good broker as compared to some others, their charting package is pathetic.
I have checked several charts and I see a clear buy trigger on USD/JPY on all of them at today's open around 120.10.
How do you feel about using MT4 charts with no sunday bar for signals and putting your trades on Oanda? I know a lot of traders use MT4 charts and other brokers for trades, including myself.
This way we will have more harmonious trades. Of course this is only my opinion, it is all up to you
Ignored
I think the bands are right; it has to be the 4-5 hour closing difference. Anyway, I have backtested using Oanda, and results are profitable. I'm pretty sure that it will be the same for you, too. If I could use something besides Oanda, I surely would, but I have a Mac... It's kind of nice to see you guys take trades according to YOUR charts anyway so if I don't show up anymore suddenly, you'll still be on your feet Well, thanks for the comment, but I'm sticking to Oanda(Not by choice).
Quote
Disliked
I entered a Long trade on USD/JPY as previously noted.
Here's the chart that prompted the trade. As noted previously, on my charts there's a clear push into resistance and a close in the channel.
I'm also short USD/CAD per Kevin's analysis.
Hey Yen and thomass,
The chart looks good! Did your USD/CAD chart look about the same as mine?
Good luck,
Kevin
PS CAD/JPY is looking potentially good for later tonight; hopefully everyone else sees it?