In the chart below we see the GBP/JPY in the confines of the H4/daily channel started around 17th March - nearly 4 months ago.
Long would seem the way to go but at the top of the chart we see strong resistance in the form of the orange bar and this formed strong support in January and strong resistance in february 2008. So it's not going to go up much.
Below you can see the bottom of the channel which also is coinciding with the 200sma. This should provide some support.
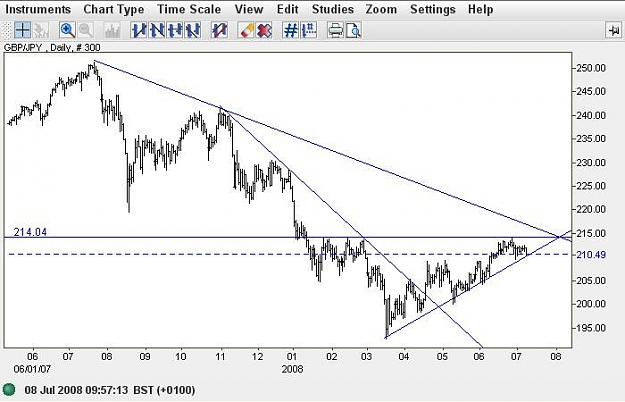
Interestingly, on the daily chart (below) at the moment, the 200sma corresponds to the orange line of resistance and could make this resistance stronger. If we look at the daily scenario my trend lines point to a break out at the end of the month. It could be explosive. My guess is it will be - and down.
Long would seem the way to go but at the top of the chart we see strong resistance in the form of the orange bar and this formed strong support in January and strong resistance in february 2008. So it's not going to go up much.
Below you can see the bottom of the channel which also is coinciding with the 200sma. This should provide some support.
Attached Image (click to enlarge)
Interestingly, on the daily chart (below) at the moment, the 200sma corresponds to the orange line of resistance and could make this resistance stronger. If we look at the daily scenario my trend lines point to a break out at the end of the month. It could be explosive. My guess is it will be - and down.
Attached Image (click to enlarge)
Gone to a better place