In my attempt to learn Jacko's method, I am reverting back to Technical Analysis 101. Because as Jacko says, everything he does, is in every book on technical analysis.
I am also learning how to plan longer term trades, and I am learning how to wait for the good setups.
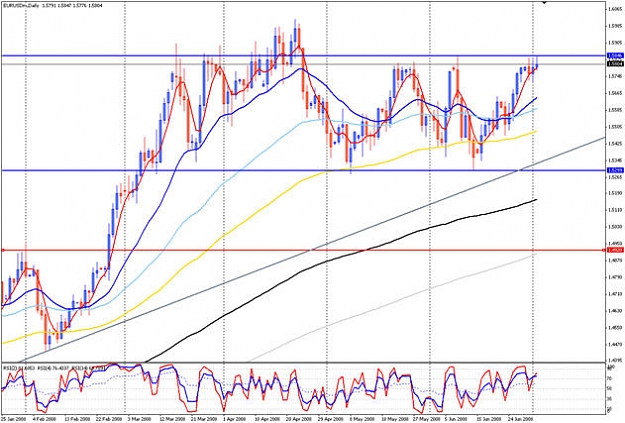
Looking at the daily chart of EUR, I see 3 distinct possibilities and would like some feed back on my analysis.
1) The price is rejected by the resistance at 1.5846 and pulls back, possibly as low as major support at 1.5300, or to the rising trendline in the 1.5450 to 1.5500 area. So we must be looking for a long opportunity on a pullback. I have seen people posting that they will be looking to go long as high as 1.5650 or 1.5700.
2) The price breaks the resistance at 1.5846 and then pulls back, near that level, as resistance becomes support. This may also give us an opportunity to go long in the 1.5800 to 1.5850 area after the pullback.
3) The price pulls back from the resistance at 1.5846 and works its way down through the support at 1.5300, where it then tests 1.5300 from below, as support becomes resistance. At this point I may start thinking that the trend is starting to change, and consider looking for short possibilities.
I made a major turning point in my trading at the begining of the year as I started to slow down, pick the best entries I could find, and trade with the trend.
I think working here with this thread and with Jacko's group is going to allow me to learn to spot even better entries and too let my positions run for maximum profit.
Thanks to everybody for contributing.
James
I am also learning how to plan longer term trades, and I am learning how to wait for the good setups.
Looking at the daily chart of EUR, I see 3 distinct possibilities and would like some feed back on my analysis.
1) The price is rejected by the resistance at 1.5846 and pulls back, possibly as low as major support at 1.5300, or to the rising trendline in the 1.5450 to 1.5500 area. So we must be looking for a long opportunity on a pullback. I have seen people posting that they will be looking to go long as high as 1.5650 or 1.5700.
2) The price breaks the resistance at 1.5846 and then pulls back, near that level, as resistance becomes support. This may also give us an opportunity to go long in the 1.5800 to 1.5850 area after the pullback.
3) The price pulls back from the resistance at 1.5846 and works its way down through the support at 1.5300, where it then tests 1.5300 from below, as support becomes resistance. At this point I may start thinking that the trend is starting to change, and consider looking for short possibilities.
I made a major turning point in my trading at the begining of the year as I started to slow down, pick the best entries I could find, and trade with the trend.
I think working here with this thread and with Jacko's group is going to allow me to learn to spot even better entries and too let my positions run for maximum profit.
Thanks to everybody for contributing.
James
Attached Image (click to enlarge)