Things to note based on my Ichimoku analysis...
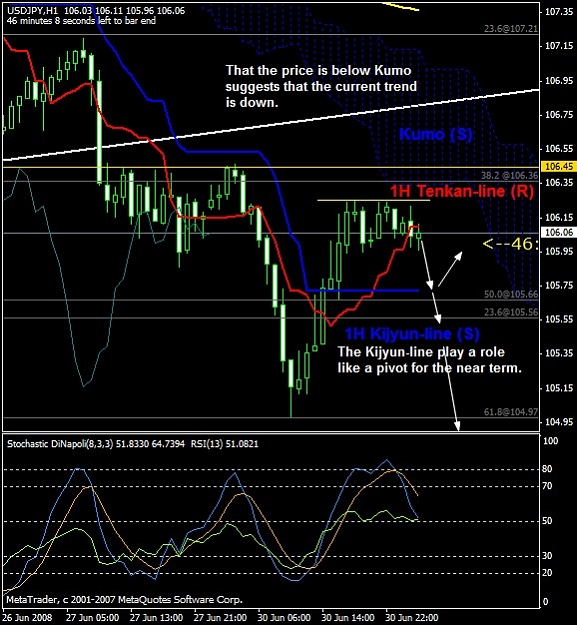
1. That the price is still below the Kumo suggest that the current trend is down.
2. If the current candle is closed below the 1H Tenkan-line, it is likely that the pair is heading lower, possibly to the Kijyun-line which plays a role like a central pivot. The Kijyun-line could be a good support, but if it is broken clearly, USD/JPY will test another lower. If the candle is closed above the Tenkan-line, bears may want to wait for selling on rally until it is closed below it.
3. In the daily chart, 106.74, which is the Tenkan-line could be a strong resistance. This is the last fort for bears if the pair starts going up from this level.
My strategy is SELL ON RALLY.
http://www.forexfactory.com/attachme...1&d=1214872272
Attached Image (click to enlarge)