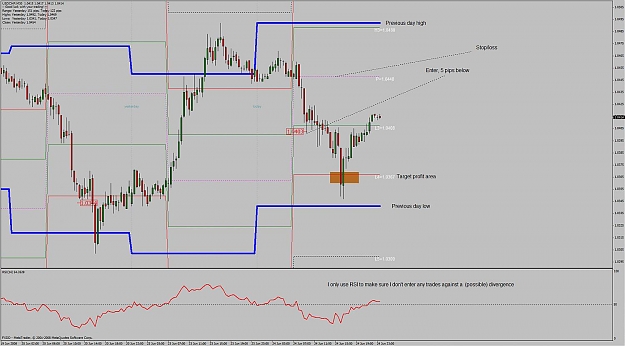
I'm messing around with some camarilla indicators but from what I have downloaded, all shows different values, found here on FF. So I found what (seems) to be the right calculation. As you probably understand, I'm completely vegetable when it comes to mt4 scripts so I wonder if someone is able to plot this values into a simple indicator ? Only if it's easy and doesn't take much of your time, of course.
Thank you.
H4 = [1.1*(H-L)/2]+C
H3 = [1.1*(H-L)/4]+C
H2 = [1.1*(H-L)/6]+C
H1 = [1.1*(H-L)/12]+C
L1 = C-[1.1*(H-L)/12]
L2 = C-[1.1*(H-L)/6]
L3 = C-[1.1*(H-L)/4]
L4 = C-[1.1*(H-L)/2]
Where:
H = Days high
L = Days low
C = Days Close
(All values are for the previous day prior to the trade day)
Thank you.
H4 = [1.1*(H-L)/2]+C
H3 = [1.1*(H-L)/4]+C
H2 = [1.1*(H-L)/6]+C
H1 = [1.1*(H-L)/12]+C
L1 = C-[1.1*(H-L)/12]
L2 = C-[1.1*(H-L)/6]
L3 = C-[1.1*(H-L)/4]
L4 = C-[1.1*(H-L)/2]
Where:
H = Days high
L = Days low
C = Days Close
(All values are for the previous day prior to the trade day)
Measure twice, cut once