Bear
Investor acting on the belief that prices or the market will decline.
Bear Market
Any market that exhibits a declining trend. In the long run they have a down turn of 20% or more.
Bull
Investor who expects markets or prices to rise.
Bull Market
A market where prices are rising or are expected to rise.
Buy a bounce
A recommendation to instigate a long trade if the price bounces from a certain level.
A strategy that focuses on buying a given security once the price of the asset falls toward an important level of support. Traders who "buy a bounce" attempt to profit from a short-term correction or "bounce" off of the identified support.
In order to use this strategy most effectively, a trader has to be sure that he or she is able to identify a valid level of support. Some traders may wish to enter a position before the signs of a bounce off of a support level, but generally this is a high-risk strategy and can result in devastating losses. Most traders will want to confirm a bounce off of a support level by using a combination of other technical indicators before entering a position.
Buy break
A recommendation to buy the currency pair if it breaks the current level specified.
A type of recommendation to buy an asset once the price is able to surpass an influential level of resistance. A move above resistance is used as a buy signal because an increase in upward momentum often follows the breakout. Buying a break is a strategy often used by traders who incorporate the use of chart patterns, trendlines and other technical indicators into their trading.
For example, suppose a stock appears to have met resistance at the $50 price level for the last year. Many traders will watch the price movement around $50 very closely because a break above the resistance would suggest that a likely surge higher will follow. Technical traders use a break above resistance to signal a good opportunity to buy because a resulting surge of upward momentum commonly follows.
Buy stops above
A recommendation to enter the market when the exchange rate breaks through a specific level. The client placing a stop entry order believes that when the market's momentum breaks through a specified level, the rate will continue in that direction.
Cable
Term used to describe the exchange rate between the US dollar and the British Pound.
Chartist
Refers to a technical analyst or one who analyses charts/graphs and data to uncover potential trends.
Correction
A reverse movement, usually negative, of at least 10% in a stock, bond, commodity or index. Corrections are generally temporary price declines, interrupting an uptrend in the market or asset.
A healthy market will correct from time to time.
Cover on a Bounce
A recommendation to exit trades on a bounce out of a support level.
The covering of a short position after it has reached and bounced off a level of support. This strategy waits for the price to move to a support level, instead of selling before, to see if the level will hold (because the trader will benefit if it doesn't hold). Once the security bounces it is clear the security will have trouble moving down further so the trade covers their short position.
Levels of support act as a backstop to a further move downward in price but can sometimes fail to hold. If a security falls below a support level it will often lead to an even stronger downward move as the level is taken out. The trader waiting for a bounce is betting that the support level will not hold and they will benefit if this materializes.
Cover on Approach
A recommendation to exit trades for profit on approach to a support level.
Dead Cat Bounce
A temporary recovery from a prolonged decline or bear market, after which the market continues to fall.
Ever heard the saying, "Even a dead cat will bounce if dropped from high enough!"?
Flat/Square
To either have no positions or positions that cancel each other out.
Fiber
Term used to describe the exchange rate between the Euro and US dollar.
Fibonacci Extensions
Levels used in Fibonacci retracement to forecast areas of support or resistance. Extensions consist of all levels drawn beyond the standard 100% level and are used by many traders to determine areas where they will wish to take profits. The most popular extension levels are 161.8%, 261.8% and 423.6%.
In practice, most traders use Fibonacci extensions in combination with other technical indicators/patterns to help them determine appropriate target prices. As this chart shows, the 161.8% level is often used to set the price target on a breakout of an ascending triangle. This specific target is calculated by multiplying the vertical distance of the triangle by the key Fibonacci ratio of 61.8% and then adding the result to the upper resistance of the triangle.
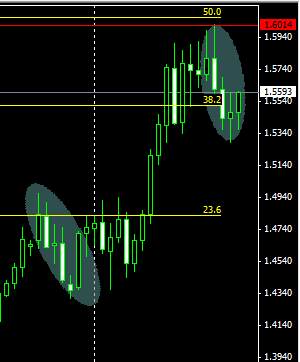
Fibonacci Retracement
A term used in technical analysis that refers to the likelihood that a financial asset's price will retrace a large portion of an original move and find support or resistance at the key Fibonacci levels before it continues in the original direction. These levels are created by drawing a trendline between two extreme points and then dividing the vertical distance by the key Fibonacci ratios of 23.6%, 38.2%, 50%, 61.8% and 100%.
Fibonacci retracement is a very popular tool used by many technical traders to help identify strategic places for transactions to be placed, target prices or stop losses. The notion of retracement is used in many indicators such as Tirone levels, Gartley patterns, Elliott Wave theory and more.
Flat On A Failure
A strategy of closing out of a position and taking profits if the security in question moves up to a target level but fails to break through it. This can be seen as a method of extracting what profit a trade has been able to produce so far because the trader believes that further movement past the target level is unlikely.
For example, suppose that a trader is in a long position on a given currency pair and the exchange rate moves upward in her favor by a moderate amount but fails to move past a key resistance level she was expecting to act as a catalyst for further movement. In this case, the trader would probably deem the trade flat on a failure and close the position out for whatever profit had been earned.
Fundamental Analysis
The analysis of economic indicators and political and current events that could effect the future direction of financial markets.
GTC (Good-till-Cancelled)
Refers to an order given by an investor to a dealer to buy or sell a security at a fixed price that is considered “good” until the investor cancels it.
Hedge/Hedging
Strategy to reduce the risk of adverse price movements on one's portfolio and to protect against the volatility of the market. Hedging typically involves selling the good forward or taking a position in a related security. Hedging becomes more prevalent with increased uncertainty about current market conditions.
One Cancels Other Order (O.C.O. Order)
An order that through its execution cancels the other part of the same order.
Panic Selling
Wide-scale selling of an investment, causing a sharp decline in price. In most instances of panic selling, investors just want to get out of the investment, with little regard for the price at which they sell.
The main problem with panic selling is that investors are selling in reaction to pure emotion and fear, rather than evaluating fundamentals. Almost every market crash is a result of panic selling. Most major stock exchanges use trading curbs and halts to limit panic selling, to allow people to digest any information on why the selling is occurring, and to restore some degree of normalcy to the market.
Pivot
A price level established as being significant either because the market fails to penetrate it or because a sudden increase in volume accompanies a move through that price level.
Pivot Point
A technical indicator derived by calculating the numerical average of a particular stock's high, low and closing prices.
The pivot point is used as a predictive indicator. If the following day's market price falls below the pivot point, it may be used as a new resistance level. Conversely, if the market price rises above the pivot point, it may act as the new support level.
Resistance
A price level at which most investors expect prices to decline further. A price at which there is sufficient supply to turn a previously uptrend downward. With regards to the forex market, it is the level at which a currency cannot rise above.
Retracement
A reversal in the movement of a stock's price, countering the prevailing trend.
An example might be market risk causing a stock's price to pull back. The Fibonacci retracement tool is favored by many traders because of its abilty to identify a price level that a correction may reach before it is able to reverse and continue in the direction of the original trend.
Reversal
A sudden change in the price direction of a stock, index, commodity, or derivative security.
Also referred to as a "trend reversal", "rally" or "correction".
A reversal can be a positive or negative change against the prevailing trend. Technical analysts watch for these patterns because they can indicate the need for a different trading strategy on the same security.
For example, if a technical analyst holds stock ABC and notices a reversal pattern, he or she may want to consider closing his/her existing long position and assuming a short position to capitalize on the potential downward movement of the stock's price.
Rollover
Refers to a process of reinvesting in which, at the expiry, the settlement is postponed until a later date. The cost of the process is measured by the interest rate differential between the two currencies.
Scalping
A trading strategy that attempts to make many profits on small price changes. Traders who implement this strategy will place anywhere from 10 to a couple hundred trades in a single day in the belief that small moves in prices are easier to catch than large ones.
Stochastic Oscillator
A technical momentum indicator that compares a security's closing price to its price range over a given time period. The oscillator's sensitivity to market movements can be reduced by adjusting the time period or by taking a moving average of the result. This indicator is calculated with the following formula:
%K = 100[(C - L14)/(H14 - L14)]
C = the most recent closing price
L14 = the low of the 14 previous trading sessions
H14 = the highest price traded during the same 14-day period.
%D = 3-period moving average of %K
The theory behind this indicator is that in an upward-trending market, prices tend to close near their high, and during a downward-trending market, prices tend to close near their low. Transaction signals occur when the %K crosses through a three-period moving average called the "%D".
StochRSI
An indicator used in technical analysis that ranges between zero and one and is created by applying the Stochastic Oscillator formula to a set of Relative Strength Index (RSI) values rather than standard price data. Using RSI values within the Stochastic formula gives traders an idea of whether the current RSI value is overbought or oversold - a measure that becomes specifically useful when the RSI value is confined between its signal levels of 20 and 80.
The StochRSI is deemed to be oversold when the value drops below 0.20, meaning the RSI value is trading at the lower end of its predefined range, and that the short-term direction of underlying security may be nearing a correction. Conversely, a reading above 0.80 suggests the RSI may be reaching extreme levels and could be used to signal a pullback in the underlying security.
Stop Order (Stop-Loss Order)
An order used to hedge against excessive loss in which a position is liquidated at a specific, prearranged price.
Support
A price level at which there is sufficient demand to turn a downtrend up.
Take-Profit Order (T/P)
An order used by currency traders specifying the exact rate or number of pips from the current price point where to close out their current position for a profit. The rate deemed to be the level where the trader wants to take a profit is sometimes referred to as the "take-profit point".
As the name suggests, take-profit orders are used to lock in profits in the event the rate moves in a favorable direction. For example, if you are long a currency pair position and believe the price will rise to a certain level, but are unsure what it will do beyond that level, placing a take-profit order at that point will automatically close out your position allowing you to lock in profit. Example: Buy $100 worth of yen at 107.4 yen per dollar = 100*107.40 = 10,740 yen
Place a take-profit order at 108.80. Price then rises from 107.40 to 108.80 Take-profit order automatically executed to sell $100 and buy 10,880 yen
Profit of 140 yen realized.
Technical Analysis
A technique used to try and predict future movements of a security, commodity or currency, based solely on past price movements and volume levels. It examines charts and historical performance.
Technical Correction
A decrease in the market price of an asset or entire market after extensive price increases. A technical correction occurs even when there is no evidence that the increasing price trend should cease. It is often caused when investors temporarily slow down their purchases of securities, which commonly leads to a pullback toward a short-term support level.
A technical correction is a drop in stock or market prices when there is no fundamental reason for a decrease. After a steady increase in value, investors may become more cautious buyers at the higher prices and look to reevaluate the market, resulting in a decrease in purchases. The drop in purchase volume will stop the upward price trend from continuing while the market re-evaluates the short-term direction.
Trendline
A line on the price or value chart of a security depicting the general direction in which the security is headed. This chart shows an example of an upward trendline:
Many people believe that prevailing trends, either up or down, will determine where a security is headed. Trendlines can be used to analyze individual securities, such as stocks, commodities or indexes, among other things.
Volatility
Refers to the tendency of prices/variables to fluctuate over time. It is most commonly measured using the coefficient of variation (the standard deviation divided by the mean). The higher the volatility, the higher the risk involved.
Whipsaw
Term used to describe sharp price movements and reversals in the market. A whipsaw would be if shortly after you bought a stock the price plummeted.
Investor acting on the belief that prices or the market will decline.
Bear Market
Any market that exhibits a declining trend. In the long run they have a down turn of 20% or more.
Bull
Investor who expects markets or prices to rise.
Bull Market
A market where prices are rising or are expected to rise.
Buy a bounce
A recommendation to instigate a long trade if the price bounces from a certain level.
A strategy that focuses on buying a given security once the price of the asset falls toward an important level of support. Traders who "buy a bounce" attempt to profit from a short-term correction or "bounce" off of the identified support.
In order to use this strategy most effectively, a trader has to be sure that he or she is able to identify a valid level of support. Some traders may wish to enter a position before the signs of a bounce off of a support level, but generally this is a high-risk strategy and can result in devastating losses. Most traders will want to confirm a bounce off of a support level by using a combination of other technical indicators before entering a position.
Buy break
A recommendation to buy the currency pair if it breaks the current level specified.
A type of recommendation to buy an asset once the price is able to surpass an influential level of resistance. A move above resistance is used as a buy signal because an increase in upward momentum often follows the breakout. Buying a break is a strategy often used by traders who incorporate the use of chart patterns, trendlines and other technical indicators into their trading.
For example, suppose a stock appears to have met resistance at the $50 price level for the last year. Many traders will watch the price movement around $50 very closely because a break above the resistance would suggest that a likely surge higher will follow. Technical traders use a break above resistance to signal a good opportunity to buy because a resulting surge of upward momentum commonly follows.
Buy stops above
A recommendation to enter the market when the exchange rate breaks through a specific level. The client placing a stop entry order believes that when the market's momentum breaks through a specified level, the rate will continue in that direction.
Cable
Term used to describe the exchange rate between the US dollar and the British Pound.
Chartist
Refers to a technical analyst or one who analyses charts/graphs and data to uncover potential trends.
Correction
A reverse movement, usually negative, of at least 10% in a stock, bond, commodity or index. Corrections are generally temporary price declines, interrupting an uptrend in the market or asset.
A healthy market will correct from time to time.
Cover on a Bounce
A recommendation to exit trades on a bounce out of a support level.
The covering of a short position after it has reached and bounced off a level of support. This strategy waits for the price to move to a support level, instead of selling before, to see if the level will hold (because the trader will benefit if it doesn't hold). Once the security bounces it is clear the security will have trouble moving down further so the trade covers their short position.
Levels of support act as a backstop to a further move downward in price but can sometimes fail to hold. If a security falls below a support level it will often lead to an even stronger downward move as the level is taken out. The trader waiting for a bounce is betting that the support level will not hold and they will benefit if this materializes.
Cover on Approach
A recommendation to exit trades for profit on approach to a support level.
Dead Cat Bounce
A temporary recovery from a prolonged decline or bear market, after which the market continues to fall.
Ever heard the saying, "Even a dead cat will bounce if dropped from high enough!"?
Flat/Square
To either have no positions or positions that cancel each other out.
Fiber
Term used to describe the exchange rate between the Euro and US dollar.
Fibonacci Extensions
Levels used in Fibonacci retracement to forecast areas of support or resistance. Extensions consist of all levels drawn beyond the standard 100% level and are used by many traders to determine areas where they will wish to take profits. The most popular extension levels are 161.8%, 261.8% and 423.6%.
In practice, most traders use Fibonacci extensions in combination with other technical indicators/patterns to help them determine appropriate target prices. As this chart shows, the 161.8% level is often used to set the price target on a breakout of an ascending triangle. This specific target is calculated by multiplying the vertical distance of the triangle by the key Fibonacci ratio of 61.8% and then adding the result to the upper resistance of the triangle.
Fibonacci Retracement
A term used in technical analysis that refers to the likelihood that a financial asset's price will retrace a large portion of an original move and find support or resistance at the key Fibonacci levels before it continues in the original direction. These levels are created by drawing a trendline between two extreme points and then dividing the vertical distance by the key Fibonacci ratios of 23.6%, 38.2%, 50%, 61.8% and 100%.
Fibonacci retracement is a very popular tool used by many technical traders to help identify strategic places for transactions to be placed, target prices or stop losses. The notion of retracement is used in many indicators such as Tirone levels, Gartley patterns, Elliott Wave theory and more.
Flat On A Failure
A strategy of closing out of a position and taking profits if the security in question moves up to a target level but fails to break through it. This can be seen as a method of extracting what profit a trade has been able to produce so far because the trader believes that further movement past the target level is unlikely.
For example, suppose that a trader is in a long position on a given currency pair and the exchange rate moves upward in her favor by a moderate amount but fails to move past a key resistance level she was expecting to act as a catalyst for further movement. In this case, the trader would probably deem the trade flat on a failure and close the position out for whatever profit had been earned.
Fundamental Analysis
The analysis of economic indicators and political and current events that could effect the future direction of financial markets.
GTC (Good-till-Cancelled)
Refers to an order given by an investor to a dealer to buy or sell a security at a fixed price that is considered “good” until the investor cancels it.
Hedge/Hedging
Strategy to reduce the risk of adverse price movements on one's portfolio and to protect against the volatility of the market. Hedging typically involves selling the good forward or taking a position in a related security. Hedging becomes more prevalent with increased uncertainty about current market conditions.
One Cancels Other Order (O.C.O. Order)
An order that through its execution cancels the other part of the same order.
Panic Selling
Wide-scale selling of an investment, causing a sharp decline in price. In most instances of panic selling, investors just want to get out of the investment, with little regard for the price at which they sell.
The main problem with panic selling is that investors are selling in reaction to pure emotion and fear, rather than evaluating fundamentals. Almost every market crash is a result of panic selling. Most major stock exchanges use trading curbs and halts to limit panic selling, to allow people to digest any information on why the selling is occurring, and to restore some degree of normalcy to the market.
Pivot
A price level established as being significant either because the market fails to penetrate it or because a sudden increase in volume accompanies a move through that price level.
Pivot Point
A technical indicator derived by calculating the numerical average of a particular stock's high, low and closing prices.
The pivot point is used as a predictive indicator. If the following day's market price falls below the pivot point, it may be used as a new resistance level. Conversely, if the market price rises above the pivot point, it may act as the new support level.
Resistance
A price level at which most investors expect prices to decline further. A price at which there is sufficient supply to turn a previously uptrend downward. With regards to the forex market, it is the level at which a currency cannot rise above.
Retracement
A reversal in the movement of a stock's price, countering the prevailing trend.
An example might be market risk causing a stock's price to pull back. The Fibonacci retracement tool is favored by many traders because of its abilty to identify a price level that a correction may reach before it is able to reverse and continue in the direction of the original trend.
Reversal
A sudden change in the price direction of a stock, index, commodity, or derivative security.
Also referred to as a "trend reversal", "rally" or "correction".
A reversal can be a positive or negative change against the prevailing trend. Technical analysts watch for these patterns because they can indicate the need for a different trading strategy on the same security.
For example, if a technical analyst holds stock ABC and notices a reversal pattern, he or she may want to consider closing his/her existing long position and assuming a short position to capitalize on the potential downward movement of the stock's price.
Rollover
Refers to a process of reinvesting in which, at the expiry, the settlement is postponed until a later date. The cost of the process is measured by the interest rate differential between the two currencies.
Scalping
A trading strategy that attempts to make many profits on small price changes. Traders who implement this strategy will place anywhere from 10 to a couple hundred trades in a single day in the belief that small moves in prices are easier to catch than large ones.
Stochastic Oscillator
A technical momentum indicator that compares a security's closing price to its price range over a given time period. The oscillator's sensitivity to market movements can be reduced by adjusting the time period or by taking a moving average of the result. This indicator is calculated with the following formula:
%K = 100[(C - L14)/(H14 - L14)]
C = the most recent closing price
L14 = the low of the 14 previous trading sessions
H14 = the highest price traded during the same 14-day period.
%D = 3-period moving average of %K
The theory behind this indicator is that in an upward-trending market, prices tend to close near their high, and during a downward-trending market, prices tend to close near their low. Transaction signals occur when the %K crosses through a three-period moving average called the "%D".
StochRSI
An indicator used in technical analysis that ranges between zero and one and is created by applying the Stochastic Oscillator formula to a set of Relative Strength Index (RSI) values rather than standard price data. Using RSI values within the Stochastic formula gives traders an idea of whether the current RSI value is overbought or oversold - a measure that becomes specifically useful when the RSI value is confined between its signal levels of 20 and 80.
The StochRSI is deemed to be oversold when the value drops below 0.20, meaning the RSI value is trading at the lower end of its predefined range, and that the short-term direction of underlying security may be nearing a correction. Conversely, a reading above 0.80 suggests the RSI may be reaching extreme levels and could be used to signal a pullback in the underlying security.
Stop Order (Stop-Loss Order)
An order used to hedge against excessive loss in which a position is liquidated at a specific, prearranged price.
Support
A price level at which there is sufficient demand to turn a downtrend up.
Take-Profit Order (T/P)
An order used by currency traders specifying the exact rate or number of pips from the current price point where to close out their current position for a profit. The rate deemed to be the level where the trader wants to take a profit is sometimes referred to as the "take-profit point".
As the name suggests, take-profit orders are used to lock in profits in the event the rate moves in a favorable direction. For example, if you are long a currency pair position and believe the price will rise to a certain level, but are unsure what it will do beyond that level, placing a take-profit order at that point will automatically close out your position allowing you to lock in profit. Example: Buy $100 worth of yen at 107.4 yen per dollar = 100*107.40 = 10,740 yen
Place a take-profit order at 108.80. Price then rises from 107.40 to 108.80 Take-profit order automatically executed to sell $100 and buy 10,880 yen
Profit of 140 yen realized.
Technical Analysis
A technique used to try and predict future movements of a security, commodity or currency, based solely on past price movements and volume levels. It examines charts and historical performance.
Technical Correction
A decrease in the market price of an asset or entire market after extensive price increases. A technical correction occurs even when there is no evidence that the increasing price trend should cease. It is often caused when investors temporarily slow down their purchases of securities, which commonly leads to a pullback toward a short-term support level.
A technical correction is a drop in stock or market prices when there is no fundamental reason for a decrease. After a steady increase in value, investors may become more cautious buyers at the higher prices and look to reevaluate the market, resulting in a decrease in purchases. The drop in purchase volume will stop the upward price trend from continuing while the market re-evaluates the short-term direction.
Trendline
A line on the price or value chart of a security depicting the general direction in which the security is headed. This chart shows an example of an upward trendline:
Many people believe that prevailing trends, either up or down, will determine where a security is headed. Trendlines can be used to analyze individual securities, such as stocks, commodities or indexes, among other things.
Volatility
Refers to the tendency of prices/variables to fluctuate over time. It is most commonly measured using the coefficient of variation (the standard deviation divided by the mean). The higher the volatility, the higher the risk involved.
Whipsaw
Term used to describe sharp price movements and reversals in the market. A whipsaw would be if shortly after you bought a stock the price plummeted.