In a big trend, there are hundreds of systems that work. But at choppy hell insane markets, how GOOD would it perform?
At your chart, unless I'm a huge scalper (which I'm not...) I would stay aside, sitting upon my $$...
Looking forward to see the answer!
Ignored
You are 100% correct. That was the problem I ran into when looking at other strategies... When the market is MOVING.. almost anything works... it's when the market is done moving or choppy as you call it that not all strategies work well.
The key is to be nimble enough to catch the market no mater which way it decides to move and NOT being afraid to close out a losing position with a loss.
This could mean, opening a position in both directions, closing out the loser and adding to the winner and riding the wave that ensues. Once the market has made up it's mind, and it begins to RUN, that's when we put on our "MONEY" trades.
For example, on the H4 charts, when we have a break of the channel we can usually expect to get some 400+ points (I've seen as little as 300, as much as 1600) but I found that 400 is a pretty safe number. So if I'm in the wrong direction at say .5 lots... and one in the right direction at .5 lots... and we start moving... I close the loser, and add 1 lot in the right direction. (this should be done on the pull back)
Bottom line.. Once you have an entry point figured out... it really all comes down to trade management. (and NOT being afraid to trade multiple positions)
When I first started out.. I would open a position.. and if it went against' me, I was afraid to open a position in the other direction... for fear I was losing to much, or fear it would reverse soon as I opened the opposite direction and now I'd have another position in the negative.
Another fault I had was when it went against me but not enough to hit my SL, I would sit on my hands and wait for price to move back into my direction.... This was a big waste of TIME.. as now I tend to open another position in the same direction and make money while price is moving back into my direction... CAUTION: This should only be done once we have defined where the S/R levels are, and only if we have a plan in place in case the trade fails.. AGAIN.. we should not be afraid to STOP & REVERSE (IE. Close out all losing positions and open in the other direction)
this is what i can see after 5 minutes looking at few charts:
1. don't trade when the price is touching and inside the lines.
2. trade when the first candle open above (buy) or below (sell) the lines.
3. take profit and stop loss is when the price touch the line.
p/s: i prefer to trade at 4H
Ignored
We have a WINNER!!!
Excellent analysis... Using this on the 4H charts will yield HUGE results EVEN when there are false signals (and there are a few... but the positive signals far out-number the false signals) AND the real signals pay-off so much that even with the false signals, we have the makings of a very simple Holy Grail.
Looking at the actual BAR can give real insights into how price will react when it's in the channel. For instance, when you see price penetrate the channel, and pull back... look for tails . as they can tell you if the pull back will KEEP pulling back (thus producing a false signal) or it's a natural pull-back and price will soon follow through...
if people are interested in how to determine when to work out that things may turn choppy or start to head sideways then try to get a hold of material by michael jenkins. excellent stuff.
obviously as stated before that knowing when to stay out is critical, trading thru the sideways periods is what kills these kinds of systems.
Ignored
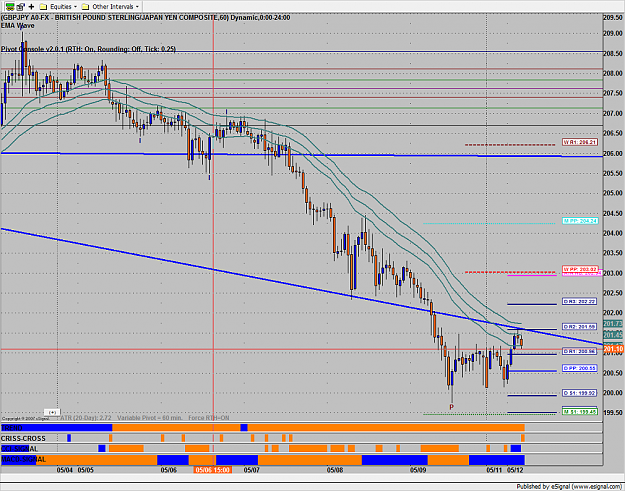
Actually the channel will tell you when price is choppy. Again you should be looking at multiple time-frames... but when the channel is FLAT-LINING... so is the market.. (good time to look for a break-out) when the channel starts pointing UP we should be biased for LONG trades and when it's pointing DOWN we should be biased for SHORT trades.
Excellent analysis... Using this on the 4H charts will yield HUGE results EVEN when there are false signals (and there are a few... but the positive signals far out-number the false signals) AND the real signals pay-off so much that even with the false signals, we have the makings of a very simple Holy Grail.
Looking at the actual BAR can give real insights into how price will react when it's in the channel. For instance, when you see price penetrate the channel, and pull back... look for tails . as they can tell you if the pull back will KEEP pulling back (thus producing a false signal) or it's a natural pull-back and price will soon follow through...
Ignored
hee.. no sweat..
maybe we can discuss trading strategy or what not
maybe u guys can try out this indi to filter flat trend!
pop
Ignored
Interesting Indicator... What I've been using is the angle of the channel... so I don't really have a "FLAT" visual.. but I do have an UP/DOWN visual that is based on the angle of the channel.
I use eSignal for my charting.. so they are programmed for eSignal... If there is an MQL Programmer who would like to translate them I would be happy to share them for the rest of the community. (As I use MT for Order Entry Only)
Please PM me if you are a knowledgeable MQL programmer and would like to help out this thread
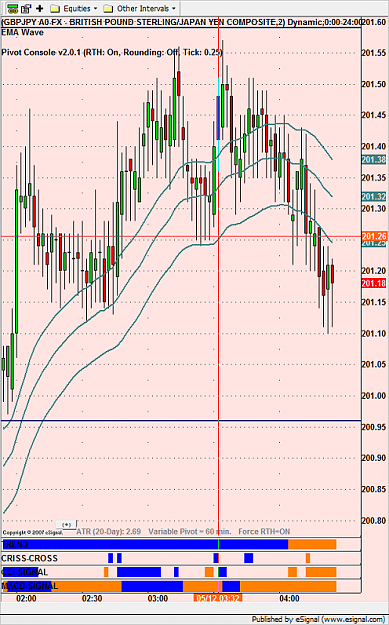
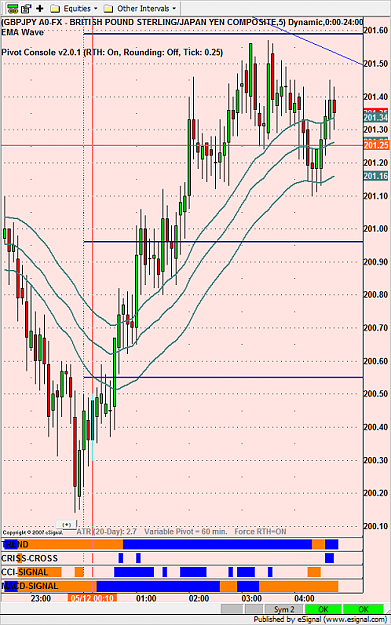
Here is my NEW M2/M5... Notice how the M2 channel has contained the price.. and the M5 looks like it's bouncing price between the HI/LOW of the channel...
There's still some work to do.. but we are still looking good for a short entry We are still looking for a clean BREAK of the M5
Notice how the LOW M2 channel is in direct relation to the CLOSE M5 channel I love how they all correlate with each other
Hi, could you please attach the indicators on the bottom of your chart and also the template? Thanks
Ignored
Again, the indicators are for eSignal.. so unless you're using eSignal they won't work... They are *.EFS files and it won't even let me upload them ...
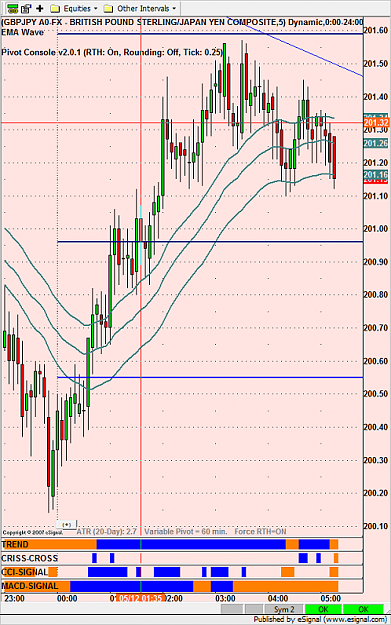
The price is being contained within the M2 channel (bouncing within) and both channels are flattening out. So now we are looking to see which way the price breaks.. Up or Down... I'm still favoring down only because there is a S/R level at 201.50...
NOTE: Trading from the 2/5 min is VERY RISKY and I don't advise it.. I just watch how price reacts and refer to my upper time frames for actual trading but these time frames will get you in very early if you do decide to use them (SCALPING comes to mind) DEMO is COOL!
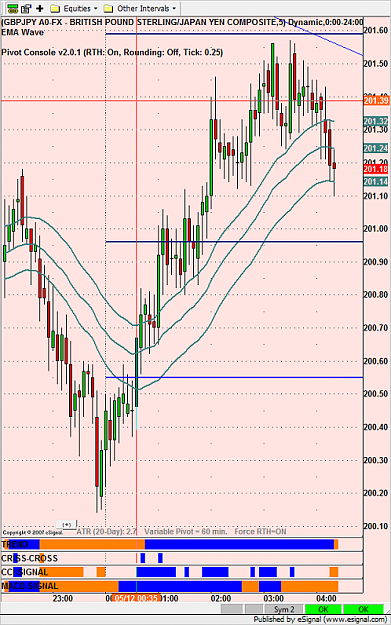
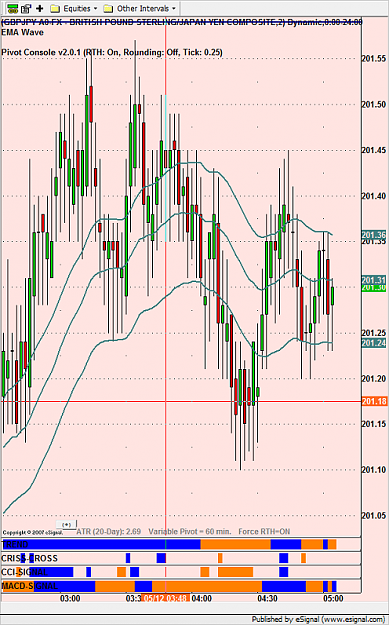
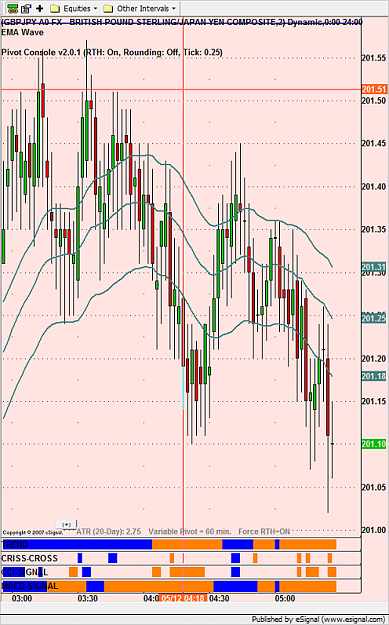
Ok.. so as predicted.. price was contained by the M2 channel.. and is breaking down on the M5 channel.. if we have a confirmed BREAK of the M5 channel.. then I would look for 1) a pull back to the CLOSE EMA M5, or 2) taking the entry without the pull back (this relates to the LOW H1 channel and I prefer to trade the higher time frames)
Notice how Price first Broke on the M2.. it pulled back and was first contained by the HI of the channel where it bounced to the bottom.. then was contained by the CLOSE (middle) of the channel.. then finally broke down
The price is being contained within the M2 channel (bouncing within) and both channels are flattening out. So now we are looking to see which way the price breaks.. Up or Down... I'm still favoring down only because there is a S/R level at 201.50...
NOTE: Trading from the 2/5 min is VERY RISKY and I don't advise it.. I just watch how price reacts and refer to my upper time frames for actual trading but these time frames will get you in very early if you do decide to use them (SCALPING comes to mind)
Ignored
thanks for the update..
im with you for continuos donwtrend!
mainly because smaller tfs..price still below ema200!
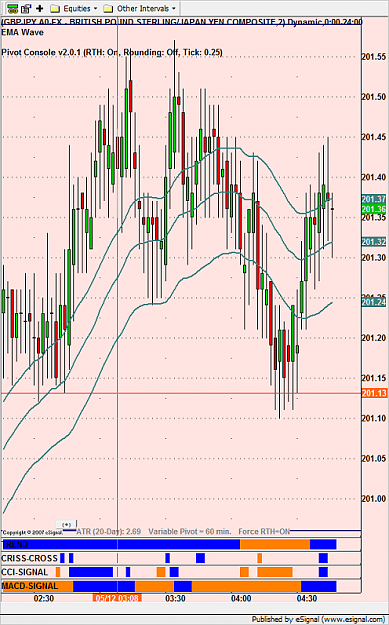
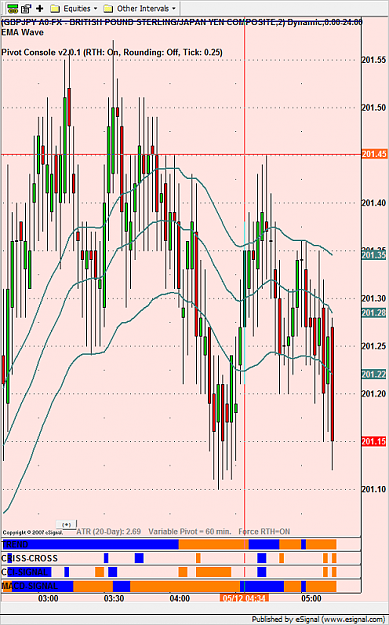
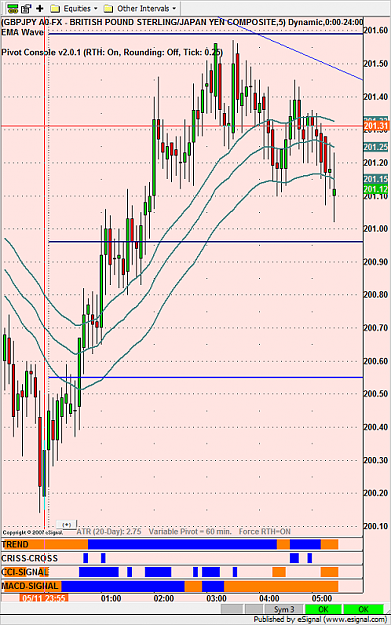
I will put in a SELL LIMIT @ 201.25 Maybe it FILLS... if NOT... no sweat If we do NOT fill.. but keep breaking down.. I may open a market order on the pull back