i know i said it was heading down, but let's stare at this chart for a moment.
yes, we had a trendline break (a close below)... BUT at this moment i see strong OS conditions; from my experience, a valid breakout is almost ALWAYS accompanied by oscillator crossing AT THE SAME TIME on the other side - in this case, stochastic beyond 50 & cci beyond 0. but just look at this drop, looks like it's already exhausted (stochastic is already around 10 while cci is around -170).
and don't you think this looks like a huge hidden bullish divergence?
Ignored
Yeah i think so, G should be bullish, and Yen and USD are just playing games. But, if it breaks that level, it could go down.
i know i said it was heading down, but let's stare at this chart for a moment.
yes, we had a trendline break (a close below)... BUT at this moment i see strong OS conditions; from my experience, a valid breakout is almost ALWAYS accompanied by oscillator crossing AT THE SAME TIME on the other side - in this case, stochastic beyond 50 & cci beyond 0. but just look at this drop, looks like it's already exhausted (stochastic is already around 10 while cci is around -170).
and don't you think this looks like a huge hidden bullish divergence?
Ignored
What??? It is a very obvious bearish divergence. Or maybe you have more other ideas of how to look at the chart.
i know i said it was heading down, but let's stare at this chart for a moment.
yes, we had a trendline break (a close below)... BUT at this moment i see strong OS conditions; from my experience, a valid breakout is almost ALWAYS accompanied by oscillator crossing AT THE SAME TIME on the other side - in this case, stochastic beyond 50 & cci beyond 0. but just look at this drop, looks like it's already exhausted (stochastic is already around 10 while cci is around -170).
and don't you think this looks like a huge hidden bullish divergence?
Ignored
GJ already cross your trendline break and it close below it. Previously just touch and up again...now it is totaly diffrent game, and Daily candle close the trendline break....
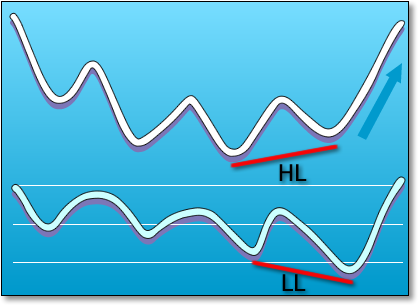
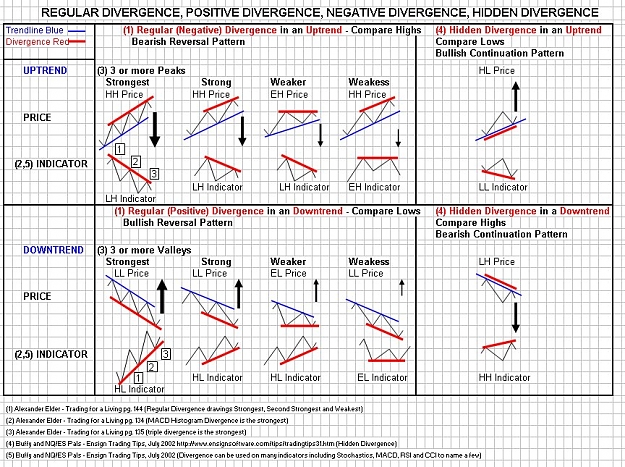
no, it would be a HIDDEN bullish. i marked it with arrows on price / white lines on indicators.
Ignored
That's right Scrat. The histogram and CCI are trending down and price is trending up. If it is not bearish divergence, what is it then? I've never seen a bullish divergence in this kind of scenario.
But on the other hand, the 4 hr chart slow stoch starting to form bullish divergence but depending if the support 202.30 holds.
Hi guys, I saw this indicator that uses the Dow/Nasdaq/Nikkei/Ftse for daily Yen pair entries, you guys might find it interesting if you can understand how it works.
no. let me point it out again for you. look at this (it's from babypips, by the way): the definition of the bullish hidden divergence - higher low in price, but lower low in indicator.
That's right Scrat. The histogram and CCI are trending down and price is trending up. If it is not bearish divergence, what is it then? I've never seen a bullish divergence in this kind of scenario.
But on the other hand, the 4 hr chart slow stoch starting to form bullish divergence but depending if the support 202.30 holds.
Sorry, i know this GU GJ thread, but doesnt GCad look dreamy? Cad being bearish, G being bullish. Has already gone up 350 pips with many more to go. Any opinions?
no. let me point it out again for you. look at this (it's from babypips, by the way): the definition of the bullish hidden divergence - higher low in price, but lower low in indicator.
Ignored
Thanks Scrat,
Always appreciate a solid explanation.
Will check it out.