Amibroker does not have an "official" point and figure plugin but PF charts are coded as anyother custom indicator. I have attached the formula .
My method:
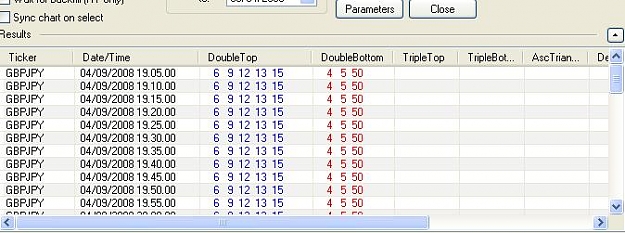
1. Scan the maket for Patterns: scanner looks for incomplete and complete patterns in a range form 5 - 50 pip.
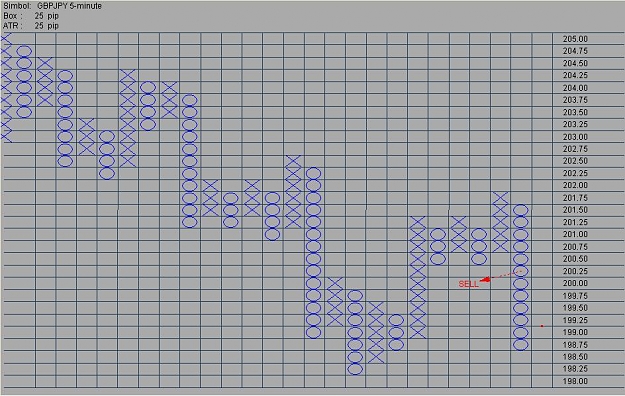
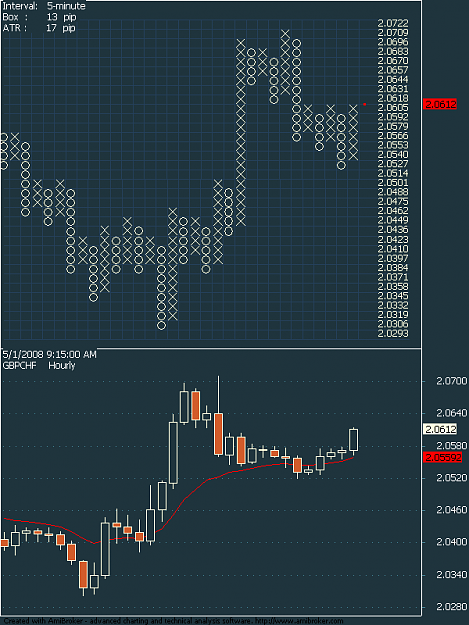
2. Resolution Check: establish whether the box size fits the timeframe. I do not have a preset box / interval parameters but a quick "Does chart look good? " check and ATR do the job pretty well.
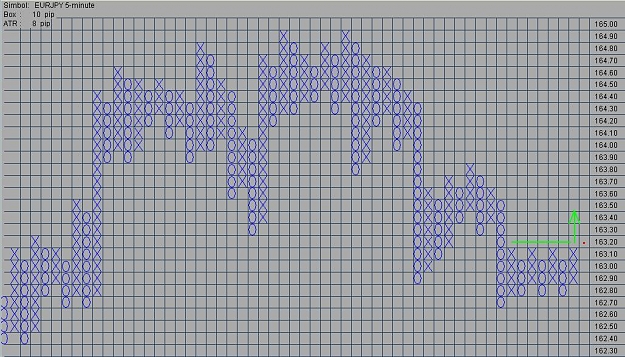
3. Identify any other entry/ exit levels within the main pattern: Switch to a lower interval, and with a scroll of a mouse wheel modify the box size and look for SR Levels and additional price patterns (double tops and bottoms are not included in the primary scan) that would validate the main pattern.
Ignored
Can you post AFL files? I'm an user of AMIBROKER too....
Maybe they are box size of chart within pattern is present?
Ignored
Yes, the numbers in the columns (example: 2 6 12 34 45) show that for the specific symbol a current pattern ( example : Double Top) is found for the box size : 2, 6, 12, 34, 45 pip.
You have to adjust AA settings:
Apply to
Feel free to check "all symbols" "use filter" or "current symbol"
Range > n last quotations: n = 1. The exploration is built to find the current pattern not historical ones.
Wait for backfill: checked. Make sure exploration runs on updated chart
sync chart on select: checked. AB will load automatically the chart for the selected symbol in AA
tip: Use mouse wheel to change box size parameter in chart's parameter window.
Curious if anyone has tried the P&F on the FX AccuCharts..
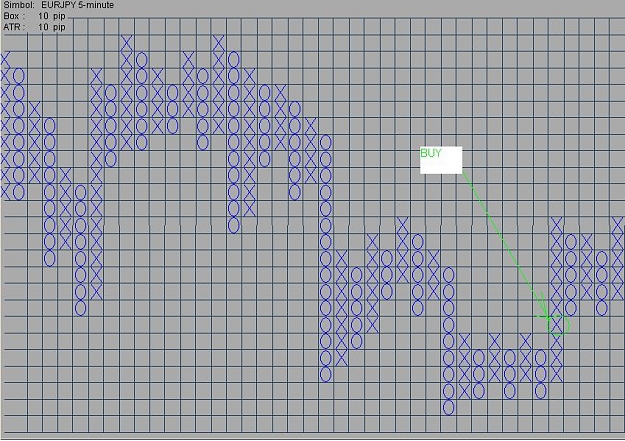
And something I would like to know also....is if your using 5min bar data to plot the X and O the price could have moved 100pips before you get a printed X or O as it would only print after the TF period is over.. instead of getting 1 "X" to indicate taking a long you may get 5 plus "X"s and you have missed the trade.. It looks good looking back in time on the chart but real time trading I am not so sure.
The only way I see it working is to use Tick data and then adjust box size and Box reversal as the filter.
And something I would like to know also....is if your using 5min bar data to plot the X and O the price could have moved 100 pips before you get a printed X or O as it would only print after the TF period is over..
Ignored
No, each X and O above the reversal level is printed real time in the moment a new high or low is recorded, there is no need to wait for the bar to complete.
So that means you would actually be using tick data and then would not matter what TF you used...as I know you can have 2 methods to plot...either using the High and Low of bar or using the closing price.
So that means you would actually be using tick data and then would not matter what TF you used...as I know you can have 2 methods to plot...either using the High and Low of bar or using the closing price.
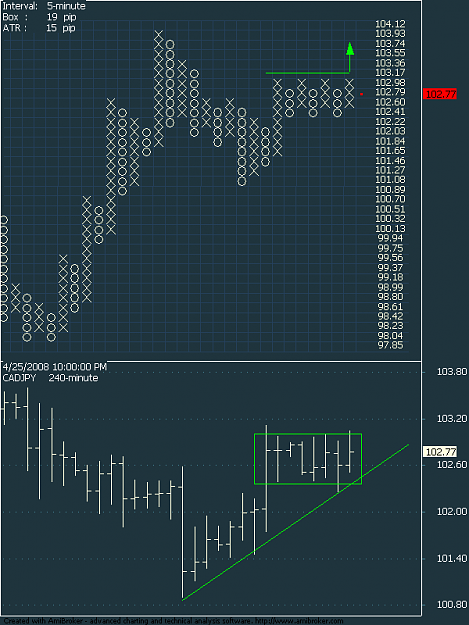
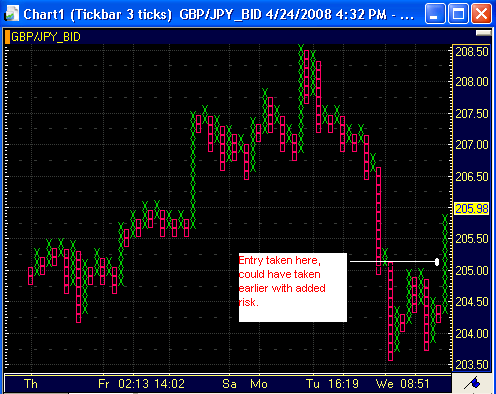
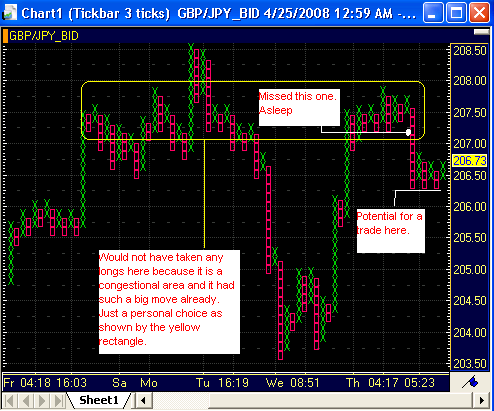
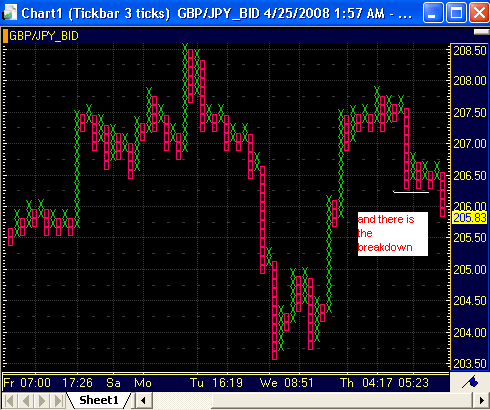
Just a bit of an update..as I it would be nice to try keep this thread alive.
After the move up it consolidated and pushed lower for another possible trade. There are certainly some personal choices to be made when using P&F from what I can see, I guess like any sort of trading.