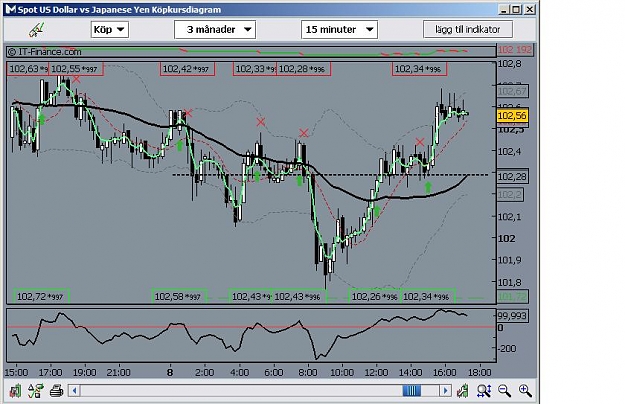
Hey guys. I wanted to share a sweet trade setup I just took on the E/J. I always look on multiple time frames to determine trends and support and resistance. With waterflame’s system I usually start by looking at the 4h to determine the strength of the overall trend.
The 4h was a bullish trend and when I saw the 1h 34 CCI coming up through the zero line as well as the 30m 34 CCI coming through the zero line I knew it was a great trade. I got in the trade a little late but I targeted 15 pips which was just shy of the R1 you see on the chart. I ended up getting out early banking 11 pips. I went in light since I don't usually trade the E/J.
You can also see the mandrake blocks all giving me a buy signal. Can you see how steep the CCI is? This is a great indication for the bullish trade. One last thing is I was above all the moving averages which is a good sign for the bulls.
Ignored
Hello Kevilulu
Yesterday Wf said to me that I was too late in my entries but if we base ourselves on the 1 hour and 30 minutes we shall be even later not ?
A+
since friday ( the day i dont trade ) , after the NFP news , i didn't thought that realy something wanna move at asian open of sunday, so i missed the the first good entries, and had to wait until european session, yesterdays euro and us sessions were pretty sick lame consolidating, and even a bit dangerous for normal scalps.
At the early begining of NZ open i tried to get warm having some pips,
3 - 34 crossing with candle confirmation breakouts just in the S/R range of geppy, my target was everytime 10 pips.
In 4 trades i had 1 loss and loosing 10 pips by stop loss protection.
At JP open we had some big spîkes at eur/usd eur/jpy and decided to continue just with gbp/jpy.
My first good moves today for the begining of this week were at near european lunch.
Well, sometimes we have to wait until the market gives us something.
Me too i had this time late entries, but i got some luck.
Nice trading Kevy, what about those mandrake blocks, are they helping us?
Ignored
Hey belekas,
I find them helpful, but I don't want to complicate WaterFlames simple system. I think you can get by without them just fine, but for me personally If I didn't use the blocks I would use momentum and stochastics as extra indicators. Just my personal preference. The downside to the blocks is they take up a good deal of cpu power on my old 2gHtz when I have 8 charts open and other programs running. I would advice any new traders to just use Waterflames system as it is without complicating anything.
Yesterday Wf said to me that I was too late in my entries but if we base ourselves on the 1 hour and 30 minutes we shall be even later not ?
A+
Ignored
I use the 15m chart for my entry because it is easier to see the pullback/retrace. I usually just use my 4h, 1h, and 30m to confirm my entry and make sure I am not opening a trade at a major resistance level. For example the 4h and 1h charts the fibopivot, 100sma, 50ema, and 200ema are major support and resistance levels for me. 30m and 15m I just use the simple system as Waterflame describes it. Let me show you some possible bad trades when the 15m chart looks like a good trade.... 1sec.
PS: you notice how the E/J never made it up to the R1. I got a good exit because I had little greed and saw the candle start to "dance". That is what I call it anyways. If you watch a candle sometimes it will "dance" up and down before a reversal or a big continuation.
This is how I use WaterFlames system. I have all my charts on the 15m timeframe. I always start by looking at the 15 min chart. What I look for is the cross of the moving averages and the 34CCI crossing the zero line. If the 15m chart looks like it is about to cross I go to my 4h chart. The green vertical line represents where I would have been looking to sell the P/J on the 15m chart. The 34sma is brown and the 3ema is gold.
1.) What I look at on my 4h chart is my trend and any major support and resistance areas. On the picture above you can see the fibopivot which is the brown lines and the gold line in the middle which is the daily pivot. On the 4h I don't pay much attention to the fibopivot unless one of my major moving averages is right on top of the daily pivot for example. What I look for is the trend which was a sideways trend. On 3-27-08 GBP/JPY it was neither bearish nor bullish.
I look at the moving averages I have which are the 100sma, 50ema, and 200ema. If my current 4h candle is above the 100(green), 50(purple), and 200(yellow) moving averages it is a bullish sign. If my candle is below it is a bearish sign. What I see on the 4h chart does not really tell me anything except the fact that the overall trend is sideways. None of the information on the 4h chart helps me. Also keep in mind the 4h chart is the least important chart I look at IMO.
2.) What I look at on my 1h chart is any major support and resistance areas. Same thing with the fibopivot on my 1h chart. It is not very important to me unless I see another indicator like one of the moving averages resting right on one of the fibopivot levels.
I look at the current candle and see that it is forming above all the moving averages and remember that this is a bullish sign. I am looking to sell the P/J on my 15m chart and because my 1h has a bullish sign I might think about taking smaller profits. If the 1h was a bearish sign I would be looking for 20-40 pips++ on the P/J normally. I use a 40 pip stop loss on the P/J always.
I also note that the CCI is rather flat and at the +100 line which is neither good or bad but I would rather have it pointing sharply down and closing in on the zero line to reinforce my bear signal I have on my 15m.
I don't give much weight to the mandrake blocks on the 1h and 4h charts, but I do note that they are both more bullish than bearish.
Based on all the bullish signs I see on my 1h and 4h charts so far the trade still might be a good sell trade, but because of these signals I will go in with less lots and exit with less pips if I decide to take the trade.... onto the 30m chart.
3.) What I look at on my 30m chart is where the CCI is in relation to the zero line and the mandrake blocks. The CCI is angling slightly up and is close to the +100 line which is a bullish sign.
The mandrake blocks are showing mixed signals.
You can see that I do not have the extra moving averages on my 30m and 15m charts. They are not important to me on my 30m and 15m charts. If I did see a major support or resistance level near the current price on my 1h and 4h charts I would have drawn a horizontal line on the 4h and 1h charts that work on all timeframes so I would see these same lines on my 15 and 30 min charts as well.
I can see nothing else that will help me on my 30m chart.
4.) What I look at on my 15m chart is : Has the 34sma crossed the 3ema?...Yes.
Has the 34CCI crossed below the zero line?...Yes.
Are the mandrake blocks all red?...Yes.
These are my sell signals.
The flat CCI on the 15m chart is a bad sign.
Two candles before the candle where the 34sma crosses down over the 3ema signaling a possible sell I see a spinning top. Spinning tops reflect uncertainty in the market. This is a bad sign.
The two things that make this trade look good are the steepness of the angle of the 34sma as it crosses the 3ema and the mandrake blocks all showing a sell signal.
If the 34CCI broke the zero line with the same steep angle that the 34sma has I might take this sell, but because of all the other bullish indicators I would not take this trade...No way.
Hope this helps
-Kevin
PS: Take these rules and apply them to the trade example of the E/J I put up and you will see why it was such a great setup for me. That trade the "stars were in alignment". Too bad it was for such a short run, and too bad I didn't go in heavier.
Ignored
It is a lesson maid of training I am going to print and to translate into French
thank a lot
A+
I may be wrong but it seems to me that the author of the system himself said that: "... neither trandlines, support resistance, HH LL, Fibs, complicated 7 different MA's at once Support Resistance conditions to analyze, Just one and only one signal for entry"
and also: "...to watch different timeframes to get an entry is useless with this system, just take one time frame your account balance will allow you to trade for your risk management, and follow the system rules."
What do we do with that? I'm personally still looking for a way to make a perfect entry. One good out of ten bad attempts just doesn't cut it for me. But you do have a point here. I'm still searching for a kind of filter to possibly rule out fake signals. Today I almost threw my notebook out the window; I buy, the price falls the moment I place the order, I sell - the price immediately goes up.
Ignored
Hey letoiny, wellcome to my world... and I think we are not alone
I know that every trade goes that way at least momentarily. Can anybody explain how to know when it is a just-wait-a-moment,-it-will-go-your-way thing and when it is a real get-out-of-this-trade,-now!! ?
I may be wrong but it seems to me that the author of the system himself said that: "... neither trandlines, support resistance, HH LL, Fibs, complicated 7 different MA's at once Support Resistance conditions to analyze, Just one and only one signal for entry"
and also: "...to watch different timeframes to get an entry is useless with this system, just take one time frame your account balance will allow you to trade for your risk management, and follow the system rules."
What do we do with that? I'm personally still looking for a way to make a perfect entry. One good out of ten bad attempts just doesn't cut it for me. But you do have a point here. I'm still searching for a kind of filter to possibly rule out fake signals. Today I almost threw my notebook out the window; I buy, the price falls the moment I place the order, I sell - the price immediately goes up.
Ignored
Hello letoiny
me, I understood of the system it is the simplicity to return but there are rules
1: the feeling of the market? Ranging, trending
2: crossing of MA 34 with MA 3
3: CCI above or below of the line 0 synchronized with MA
4: the S/R more FIBO
5: the recognition of paterns and candles
6:trendlines
and more
I think system is simple but not simplistic
A+
This is how I use WaterFlames system. I have all my charts on the 15m timeframe. I always start by looking at the 15 min chart. What I look for is the cross of the moving averages and the 34CCI crossing the zero line. If the 15m chart looks like it is about to cross I go to my 4h chart. The green vertical line represents where I would have been looking to sell the P/J on the 15m chart. The 34sma is brown and the 3ema is gold.
1.) What I look at on my 4h chart is my trend and any major support and resistance areas. On the picture above you can see the fibopivot which is the brown lines and the gold line in the middle which is the daily pivot. On the 4h I don't pay much attention to the fibopivot unless one of my major moving averages is right on top of the daily pivot for example. What I look for is the trend which was a sideways trend. On 3-27-08 GBP/JPY it was neither bearish nor bullish.
I look at the moving averages I have which are the 100sma, 50ema, and 200ema. If my current 4h candle is above the 100(green), 50(purple), and 200(yellow) moving averages it is a bullish sign. If my candle is below it is a bearish sign. What I see on the 4h chart does not really tell me anything except the fact that the overall trend is sideways. None of the information on the 4h chart helps me. Also keep in mind the 4h chart is the least important chart I look at IMO.
2.) What I look at on my 1h chart is any major support and resistance areas. Same thing with the fibopivot on my 1h chart. It is not very important to me unless I see another indicator like one of the moving averages resting right on one of the fibopivot levels.
I look at the current candle and see that it is forming above all the moving averages and remember that this is a bullish sign. I am looking to sell the P/J on my 15m chart and because my 1h has a bullish sign I might think about taking smaller profits. If the 1h was a bearish sign I would be looking for 20-40 pips++ on the P/J normally. I use a 40 pip stop loss on the P/J always.
I also note that the CCI is rather flat and at the +100 line which is neither good or bad but I would rather have it pointing sharply down and closing in on the zero line to reinforce my bear signal I have on my 15m.
I don't give much weight to the mandrake blocks on the 1h and 4h charts, but I do note that they are both more bullish than bearish.
Based on all the bullish signs I see on my 1h and 4h charts so far the trade still might be a good sell trade, but because of these signals I will go in with less lots and exit with less pips if I decide to take the trade.... onto the 30m chart.
3.) What I look at on my 30m chart is where the CCI is in relation to the zero line and the mandrake blocks. The CCI is angling slightly up and is close to the +100 line which is a bullish sign.
The mandrake blocks are showing mixed signals.
You can see that I do not have the extra moving averages on my 30m and 15m charts. They are not important to me on my 30m and 15m charts. If I did see a major support or resistance level near the current price on my 1h and 4h charts I would have drawn a horizontal line on the 4h and 1h charts that work on all timeframes so I would see these same lines on my 15 and 30 min charts as well.
I can see nothing else that will help me on my 30m chart.
4.) What I look at on my 15m chart is : Has the 34sma crossed the 3ema?...Yes.
Has the 34CCI crossed below the zero line?...Yes.
Are the mandrake blocks all red?...Yes.
These are my sell signals.
The flat CCI on the 15m chart is a bad sign.
Two candles before the candle where the 34sma crosses down over the 3ema signaling a possible sell I see a spinning top. Spinning tops reflect uncertainty in the market. This is a bad sign.
The two things that make this trade look good are the steepness of the angle of the 34sma as it crosses the 3ema and the mandrake blocks all showing a sell signal.
If the 34CCI broke the zero line with the same steep angle that the 34sma has I might take this sell, but because of all the other bullish indicators I would not take this trade...No way.
Hope this helps
-Kevin
PS: Take these rules and apply them to the trade example of the E/J I put up and you will see why it was such a great setup for me. That trade the "stars were in alignment". Too bad it was for such a short run, and too bad I didn't go in heavier.
Ignored
Good observation of this system.I wonder if we need to look that far into it though?I have noticed with a lot of trades, price will turn against you and come right back to the prior candle before the ema's cross.Put your stop a couple of pips above that if that is how you are using your stoploss(some food for thought).
I really want to respect Waterflames thread by not hijacking it with a different system. In my wierd mind I figure I give this thread respect by explaining how I personally use the system to make profitable trades. I had considered putting these post up on my thread and linking to it but that didn't seem right. Trading is not an exact science. You can have 100 people following the same system eactly and have only a small percentage of the 100 making the same winning trades as the creator of the system for any number of reasons. I know it took Flame more than just a couple minutes to come up with this system. I also know that trading any system you have to have basic knowledge of forex to make educated entries and educated exits. This is why 100 people will have different results with the same system. We all have learned to trade differently. I consider myself to be a beginner in trading since I have only been live for 2 months. In this time I have made over 450 live trades. I have 69% good trades and 31% bad trades. The problem is my bad trades are 2x-3x bigger losses than my average winning trades so my account balance is negative by a little. Most people lose all their money in forex so it is my goal to help spread what little knowledge I have gained to help others just like Flame has done. I agree that adding a bunch of extra indicators may be detrimental to the system as it was designed, but each trader needs to develope and trade in the way that suits them.
and also: "...to watch different timeframes to get an entry is useless with this system, just take one time frame your account balance will allow you to trade for your risk management, and follow the system rules."
Ignored
I disagree, respectfully. A simple reason is this: If you trade against the trend all the time you will have more bad trades than if you trade with the trend.
It's human nature to want to make something great, better. I'm not saying the way I trade is better, just saying I trade the way that suits me. I noticed cmfx having some bad trades and that is why I posted this. I will gladly remove it if Flame would like me to.
to begin at all, i've neer said that trading would be easy, neither with this system, and i didn't told also that the system is for everyone, newcomers included.
As i wrote that most technical analysis can become useless ( it doesn't mean to ignore them at all ) but most of the rules set identify for you the conditions.
Example is to not to trade big candles, not to trade lazy markets, they reaveal for you a ranging area of support resistance, and allows you too, if in this area some good advertising and confirmation candles appear, you can scalp your ten pips out.
The stop loss was explained again by the Advertising candle, hard stop would be the previous candle of the advertising candle. ( if realy 3 - 34 cross appears, you would be out )
Market moods were explained not for pleasure, because most of traders know that markets have a live cycle, from introducing to a lead in, than to maturity, resting and weakening.
Healthy markets appear from the introducing of the strongness, and also in the weakening part of the cyclus ( we trade pairs, you can go long or short )
Maturity and resting becomes Sick an lazy markets, and it depends too of your tradig time, trading sessions, pairs you trade in time etc.
The part of only trading one timeframe comes from...
a trend begins from the 1 Min chart, and not the opposite, so if you wish to catch a good move, you need to be in from the begining, and not jmp in when it will maybe finish or rest.
Thats why i trade mostly the 15 min to have a nice begining, and even if 1 H chart retrace, or consolidate, you have with CCI and the price action candles information scalp possibilities, you have the entry rules, and you have a good stop loss.
Its about to follow the rules, discipline and practise, patience...