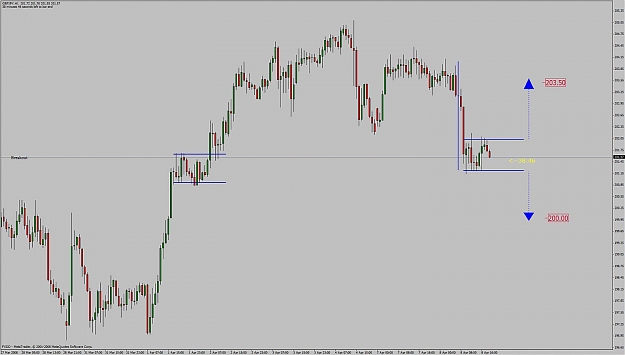
... Hope so Able to break upperline of acending and decending trendlines...
- Post #1,181
- Quote
- Apr 8, 2008 5:07am Apr 8, 2008 5:07am
- | Joined Oct 2007 | Status: Technical Trader | 765 Posts
- Post #1,182
- Quote
- Apr 8, 2008 6:20am Apr 8, 2008 6:20am
- Joined Aug 2007 | Status: Member | 3,135 Posts
Measure twice, cut once

- Post #1,184
- Quote
- Apr 8, 2008 7:19am Apr 8, 2008 7:19am
- Joined Aug 2007 | Status: Member | 3,135 Posts
Measure twice, cut once
- Post #1,185
- Quote
- Apr 8, 2008 7:23am Apr 8, 2008 7:23am
- | Joined Feb 2008 | Status: FOREX - 10% skills, 90% psychology | 1,000 Posts
- Post #1,187
- Quote
- Apr 8, 2008 7:28am Apr 8, 2008 7:28am
- | Joined Feb 2008 | Status: FOREX - 10% skills, 90% psychology | 1,000 Posts
- Post #1,189
- Quote
- Apr 8, 2008 8:10am Apr 8, 2008 8:10am
- | Joined Oct 2007 | Status: Technical Trader | 765 Posts
- Post #1,190
- Quote
- Apr 8, 2008 8:14am Apr 8, 2008 8:14am
- | Joined Oct 2007 | Status: Technical Trader | 765 Posts
- Post #1,191
- Quote
- Apr 8, 2008 8:38am Apr 8, 2008 8:38am
- | Joined Oct 2007 | Status: Technical Trader | 765 Posts
- Post #1,193
- Quote
- Apr 8, 2008 10:25am Apr 8, 2008 10:25am
- Joined Aug 2007 | Status: Member | 3,135 Posts
Measure twice, cut once
- Post #1,194
- Quote
- Apr 8, 2008 10:32am Apr 8, 2008 10:32am
- Joined Aug 2007 | Status: Member | 3,135 Posts
Measure twice, cut once
- Post #1,195
- Quote
- Apr 8, 2008 10:58am Apr 8, 2008 10:58am
- | Joined Feb 2008 | Status: FOREX - 10% skills, 90% psychology | 1,000 Posts
- Post #1,196
- Quote
- Apr 8, 2008 11:12am Apr 8, 2008 11:12am
- Joined Aug 2007 | Status: Member | 3,135 Posts
Measure twice, cut once
- Post #1,197
- Quote
- Apr 8, 2008 11:14am Apr 8, 2008 11:14am
- | Joined Feb 2008 | Status: FOREX - 10% skills, 90% psychology | 1,000 Posts
- Post #1,198
- Quote
- Apr 8, 2008 1:31pm Apr 8, 2008 1:31pm
- Joined Aug 2007 | Status: Member | 3,135 Posts
Measure twice, cut once
- Post #1,199
- Quote
- Apr 8, 2008 1:47pm Apr 8, 2008 1:47pm
- | Joined Oct 2007 | Status: Technical Trader | 765 Posts
- Post #1,200
- Quote
- Apr 8, 2008 1:58pm Apr 8, 2008 1:58pm
- | Joined Oct 2007 | Status: Technical Trader | 765 Posts