This is a trade I took just a while ago, all based on the 5 minute.
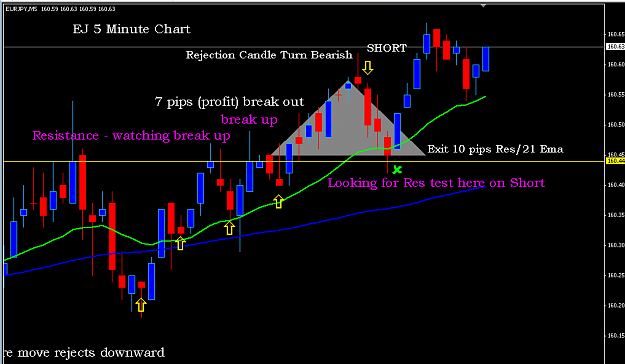
I will show two charts; 1) 5min Line Chart, 2) 5min Candle Chart
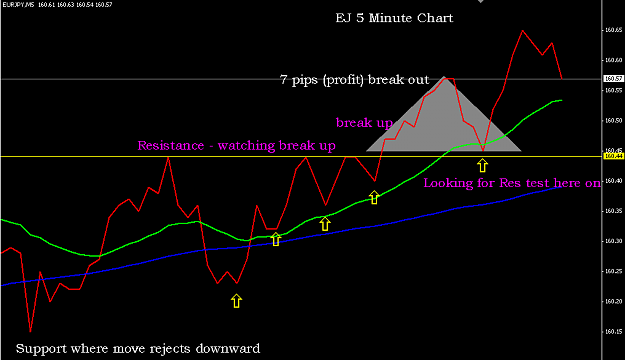
Line Chart
Price finds Resistance at 160.44 with three taps, on the third tap I start to look for a breakout upwards, one important factor is a the third move upwards and the incline of the valleys moving upwards each time (yellow arrows) and riding along the 21 EMA (green).
This is a quick move here, on the break out we take a Long knowing there is a 7-10 pip move usually on each break, be in and out quick, because most times price likes to come right back down to test the breaking resistance line.
I took a Long for 7 pips, the exited as usual with small targets.
Next I am watching the 5 minute candle formation to give me clue when price is going to go back to test the resistance.
Next Post......
I will show two charts; 1) 5min Line Chart, 2) 5min Candle Chart
Line Chart
Price finds Resistance at 160.44 with three taps, on the third tap I start to look for a breakout upwards, one important factor is a the third move upwards and the incline of the valleys moving upwards each time (yellow arrows) and riding along the 21 EMA (green).
This is a quick move here, on the break out we take a Long knowing there is a 7-10 pip move usually on each break, be in and out quick, because most times price likes to come right back down to test the breaking resistance line.
I took a Long for 7 pips, the exited as usual with small targets.
Next I am watching the 5 minute candle formation to give me clue when price is going to go back to test the resistance.
Next Post......
Attached Image (click to enlarge)