Hello,
My name is Jon and I have been a forex factory reader for three years. Recently during the past year my trading has become consistently profitable. I still have a lot of work to do but I am happy with my progress. Over the next year I would like to write my ideas in the forums for the purpose of: making myself a better trader through greater understanding of my own techniques, sharing my ideas for the benefit of others, and sharing my ideas for constructive criticism. Ninety nine percent of what I say is not original. My ideas are collected from a broad spectrum sources and I wish to thank everyone who shares their knowledge.
Before beginning I want to emphasize the difference between technical and fundamental analysis. Both methods are necessary for my profitability. Fundamental analysis helps me understand who has the power in the market. As in the dollar bears currently have the power in the market. Knowing where the strength comes from in fundamental terms allows me to trade confidently. I can stay out of the market and wait for opportunities to present themselves, or I can enter the trade quickly as soon as my technicals give me the okay. When I first started trading I could have shorted something as easily as I could have gone long. Usually I was able to give evidence that supported both a long and a short position at the same time. I believe this came from relying solely on technical analysis.
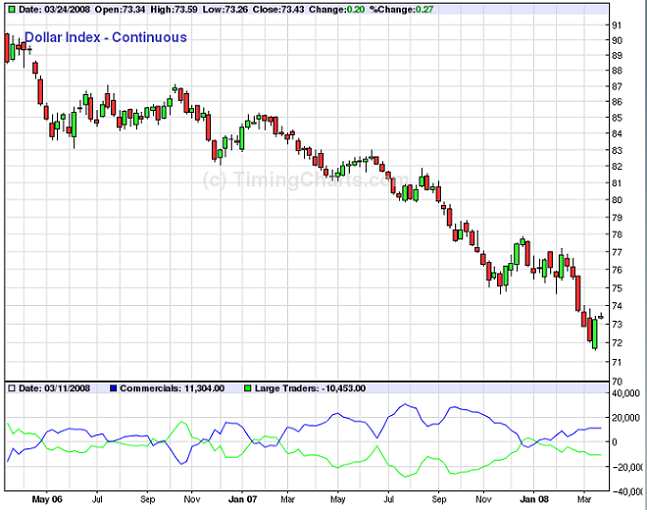
With that said, I love technical analysis. It is a true money maker. I tried to trade using only fundamental analysis, and I found that without skilled chart reading I could not find proper places to enter the market. I also rode out many a reversal waiting for the overall trend to take over again. Technical analysis has allowed me to trade confidently with the trend and even against it. Currently I am trading the dollar long even though I feel the overall dollar market is negative.
As a new trader I did not understand how to effectively use fundamental analysis. Technical analysis was easy to learn and easy to apply. Often I could draw a technical picture of the market in half an hour. Honestly, fundamental analysis is just as easy to use. Like anything else it requires discipline. The trick to fundamental analysis is getting over the learning curve. Like technicals it was hard to figure out where I should apply most of my effort. It was hard for me to figure out which pieces of fundamental data were really driving the market. Eventually I think all traders should be able to explain on an elementary level what the following mean: cot data, key interest rates, current account, gdp, cpi, net capital flows, government finances, and foreign exchange reserves. I may have missed some but it's a start. It is also true that one thing may be important for Japan and less important for Canada. Luckily The Forex Factory does a fantastic job of giving us resources, member support, and a glossary education.
Using fundamentals is not time consuming. Learning fundamentals can be time consuming. I recommend spending fifteen to thirty minutes a day reading anything you can get your hands on, including: The Economist, IBD, Wall Street Journal, Financial Times, Wikipedia, Investopedia, Bloomberg.com, Baby Pips, Forex Factory, and the websites of the Major Central Banks. There are many more resources, in fact, using Google is a fast and easy way to find info on any topic. After a while you will create a database in your mind. You will find that from day one you will be better informed and will make better decisions. Soon you will realize that your knowledge of the world and its financial markets is extensive and you will be surprised at how little effort it required to learn. Once you have a broad but shallow understanding of the market I feel you have enough knowledge to effectively use fundamentals when making trading decisions. At this point all of the hard work is behind you. Now you simply spend a small amount of time each day or week to keep yourself up to date on any changes in the fundamental picture. Fundamentals change slowly so most people will probably spend more time reading charts than worrying about how a rising Yuan will affect the Yen. I enjoy reading and watching financial media, therefore, the amount of time I dedicate to the fundamentals may seem obscene to most people. If I wanted to I could probably get all the information I needed in just five minutes a day.
Remember this, the key to fundamentals is to draw a broad, generalized picture on paper or in your head that describes market conditions. Do not let yourself believe that other traders are privy to information and that because you lack this information you are trading from an inferior position. That could happen with a stock, but with something like a global currency we all have the necessary information to make money. What sets people apart is there technical ability and their confidence.
Now that we got that out of the way, here is what I consider to be the first of two very important factors that I use to draw a fundamental picture of the market. There are more second tier factors that I will describe in the future.
Remember I am putting this out here for your thoughts. Analyze and use this information then get back to me with your results.
In order to use this information you will have to go to this website and set your charts up accordingly.
timingcharts.com
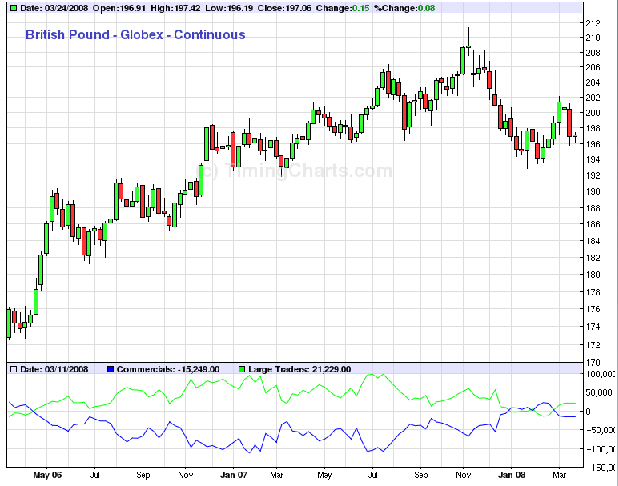
The default chart is always the S and P chart. Change the top portion to:
Commodity:to whichever one you wish to analyze. I use Globex.
Change Daily to Weekly.
Change History to two to five years.
I change Price Overlay to none.
I change Chart Type to Candlestick.
On the bottom of the page I remove the Red Specs line by unclicking the box, in my opinion you don't want to follow these guys.
For further instructions you can type "explain cot charts" into google and look for any one of a number of sites dedicated to explaining cot chart analysis. My only advice is keep it simple not complicated. I used this site to double check myself http://www.tradefutures.co.uk/power_of_cot_charts.htm, I don't remember the first site I used to learn cot analysis.
Here is how I read these charts:
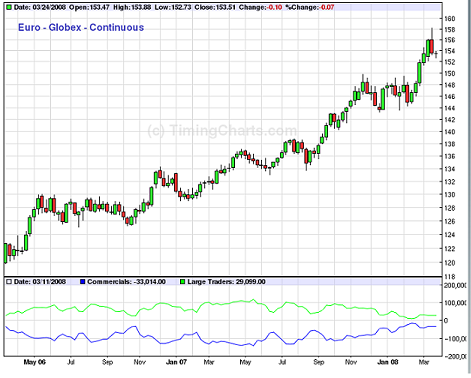
Rule 1. If the green line is above the blue line I tend to go long.
Rule 2. If the green line is below the blue line I tend to go short.
Remember that I only use this information to draw a broad picture of the market. For some currencies the picture will be very clear...feel confident to trade those currencies more. Sometimes the picture will be confusing. If confused, either wait a week or two for the chart to clear up or remember that you should rely on chart reading to understand the current direction of the market and that COT Data is only a broad tool.
In addition to rules one and two there are other ways to read the green line. Follow the slope of the line, especially if:
the line just changed directions or
the line just came from an extreme position and is heading back to the zero line.
Be aware of double tops and bottoms.
Please do not try to use anything I say as a means of predicting the future direction of a particular currency. We are followers. Analyze these charts and use technical analysis to guide you in and out of the market. These charts and other data should make you feel comfortable about being long or short a certain instrument.
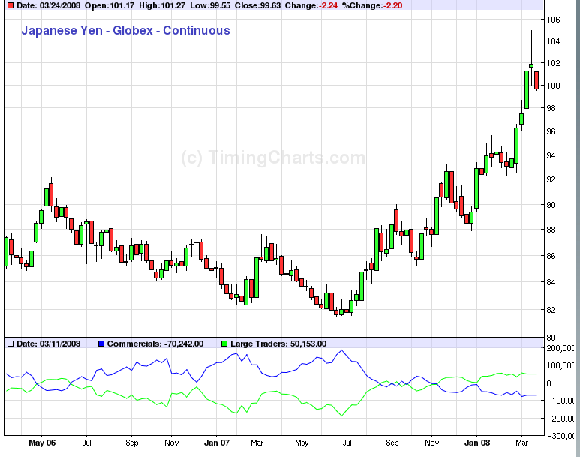
Remember that all of these charts are really the AUD/USD, CHF/USD, JPY/USD, etc. This is how the currencies list on the futures market, which is where this data comes from. You will need to invert the JPY and CHF chart in order to orient the COT charts to your Forex Broker charts. It gets a little trickier if you try and use this data to decide which direction to trade one of the crosses, ie the GBP/CHF.
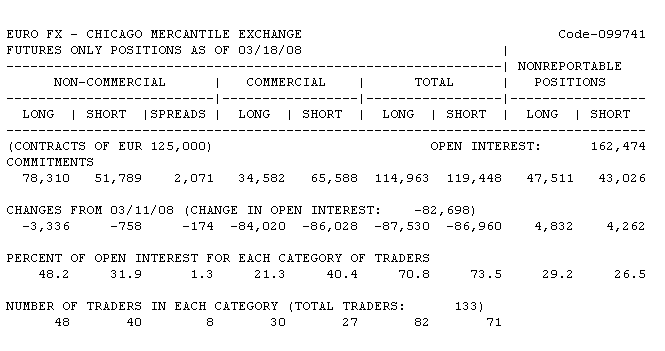
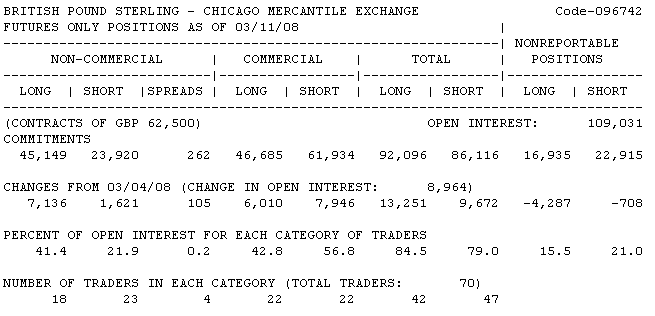
Why the COT data? Some out there may be wondering why Futures data is useful to our OTC market. The spot market does not give us volume data. This is the only place we can get volume information, as they say, it's better than nothing.
Why follow large traders and not commerical traders? I have noticed that some websites/organizations use these terms interchangeably. For the purposes of this post I use the same terms as the website timingcharts.com. From my understanding commerical traders are banks or other institutions whose purpose in the futures market is to buy an insurance policy in the form of a futures contract. The large traders sell that insurance policy and in lui of payment they recieve an opportunity to profit from the risk they assume and they determine the prices in the market. When the bulls are in charge the market goes up and when the bears are in charge the market goes down. We know who's in charge by reading the bottom of the page (timingcharts.com)under the chart where it says Net Position. We are trading with the Net Position. This means we are taking the long positions of the trader categories and subtracting the short positions to see whether the major traders are net long or short. If you add in the speculators the two sides become even. There always has to be a buyer for each seller. Go to www.cftc.gov for more info and the actual COT Data.
COT data comes out every Tuesday, but the charts dont update until Friday. As I stated earlier, fundamentals do not change quickly. This information is a week behind, but that should not make a big difference.
I hope I covered everything. If I did miss anything you should be able to figure it out by just looking at the COT Charts or by asking questions. When I started using the COT Charts I looked at them daily for a deep understanding, now I look at them once a week.
My name is Jon and I have been a forex factory reader for three years. Recently during the past year my trading has become consistently profitable. I still have a lot of work to do but I am happy with my progress. Over the next year I would like to write my ideas in the forums for the purpose of: making myself a better trader through greater understanding of my own techniques, sharing my ideas for the benefit of others, and sharing my ideas for constructive criticism. Ninety nine percent of what I say is not original. My ideas are collected from a broad spectrum sources and I wish to thank everyone who shares their knowledge.
Before beginning I want to emphasize the difference between technical and fundamental analysis. Both methods are necessary for my profitability. Fundamental analysis helps me understand who has the power in the market. As in the dollar bears currently have the power in the market. Knowing where the strength comes from in fundamental terms allows me to trade confidently. I can stay out of the market and wait for opportunities to present themselves, or I can enter the trade quickly as soon as my technicals give me the okay. When I first started trading I could have shorted something as easily as I could have gone long. Usually I was able to give evidence that supported both a long and a short position at the same time. I believe this came from relying solely on technical analysis.
With that said, I love technical analysis. It is a true money maker. I tried to trade using only fundamental analysis, and I found that without skilled chart reading I could not find proper places to enter the market. I also rode out many a reversal waiting for the overall trend to take over again. Technical analysis has allowed me to trade confidently with the trend and even against it. Currently I am trading the dollar long even though I feel the overall dollar market is negative.
As a new trader I did not understand how to effectively use fundamental analysis. Technical analysis was easy to learn and easy to apply. Often I could draw a technical picture of the market in half an hour. Honestly, fundamental analysis is just as easy to use. Like anything else it requires discipline. The trick to fundamental analysis is getting over the learning curve. Like technicals it was hard to figure out where I should apply most of my effort. It was hard for me to figure out which pieces of fundamental data were really driving the market. Eventually I think all traders should be able to explain on an elementary level what the following mean: cot data, key interest rates, current account, gdp, cpi, net capital flows, government finances, and foreign exchange reserves. I may have missed some but it's a start. It is also true that one thing may be important for Japan and less important for Canada. Luckily The Forex Factory does a fantastic job of giving us resources, member support, and a glossary education.
Using fundamentals is not time consuming. Learning fundamentals can be time consuming. I recommend spending fifteen to thirty minutes a day reading anything you can get your hands on, including: The Economist, IBD, Wall Street Journal, Financial Times, Wikipedia, Investopedia, Bloomberg.com, Baby Pips, Forex Factory, and the websites of the Major Central Banks. There are many more resources, in fact, using Google is a fast and easy way to find info on any topic. After a while you will create a database in your mind. You will find that from day one you will be better informed and will make better decisions. Soon you will realize that your knowledge of the world and its financial markets is extensive and you will be surprised at how little effort it required to learn. Once you have a broad but shallow understanding of the market I feel you have enough knowledge to effectively use fundamentals when making trading decisions. At this point all of the hard work is behind you. Now you simply spend a small amount of time each day or week to keep yourself up to date on any changes in the fundamental picture. Fundamentals change slowly so most people will probably spend more time reading charts than worrying about how a rising Yuan will affect the Yen. I enjoy reading and watching financial media, therefore, the amount of time I dedicate to the fundamentals may seem obscene to most people. If I wanted to I could probably get all the information I needed in just five minutes a day.
Remember this, the key to fundamentals is to draw a broad, generalized picture on paper or in your head that describes market conditions. Do not let yourself believe that other traders are privy to information and that because you lack this information you are trading from an inferior position. That could happen with a stock, but with something like a global currency we all have the necessary information to make money. What sets people apart is there technical ability and their confidence.
Now that we got that out of the way, here is what I consider to be the first of two very important factors that I use to draw a fundamental picture of the market. There are more second tier factors that I will describe in the future.
Remember I am putting this out here for your thoughts. Analyze and use this information then get back to me with your results.
In order to use this information you will have to go to this website and set your charts up accordingly.
timingcharts.com
The default chart is always the S and P chart. Change the top portion to:
Commodity:to whichever one you wish to analyze. I use Globex.
Change Daily to Weekly.
Change History to two to five years.
I change Price Overlay to none.
I change Chart Type to Candlestick.
On the bottom of the page I remove the Red Specs line by unclicking the box, in my opinion you don't want to follow these guys.
For further instructions you can type "explain cot charts" into google and look for any one of a number of sites dedicated to explaining cot chart analysis. My only advice is keep it simple not complicated. I used this site to double check myself http://www.tradefutures.co.uk/power_of_cot_charts.htm, I don't remember the first site I used to learn cot analysis.
Here is how I read these charts:
Rule 1. If the green line is above the blue line I tend to go long.
Rule 2. If the green line is below the blue line I tend to go short.
Remember that I only use this information to draw a broad picture of the market. For some currencies the picture will be very clear...feel confident to trade those currencies more. Sometimes the picture will be confusing. If confused, either wait a week or two for the chart to clear up or remember that you should rely on chart reading to understand the current direction of the market and that COT Data is only a broad tool.
In addition to rules one and two there are other ways to read the green line. Follow the slope of the line, especially if:
the line just changed directions or
the line just came from an extreme position and is heading back to the zero line.
Be aware of double tops and bottoms.
Please do not try to use anything I say as a means of predicting the future direction of a particular currency. We are followers. Analyze these charts and use technical analysis to guide you in and out of the market. These charts and other data should make you feel comfortable about being long or short a certain instrument.
Remember that all of these charts are really the AUD/USD, CHF/USD, JPY/USD, etc. This is how the currencies list on the futures market, which is where this data comes from. You will need to invert the JPY and CHF chart in order to orient the COT charts to your Forex Broker charts. It gets a little trickier if you try and use this data to decide which direction to trade one of the crosses, ie the GBP/CHF.
Why the COT data? Some out there may be wondering why Futures data is useful to our OTC market. The spot market does not give us volume data. This is the only place we can get volume information, as they say, it's better than nothing.
Why follow large traders and not commerical traders? I have noticed that some websites/organizations use these terms interchangeably. For the purposes of this post I use the same terms as the website timingcharts.com. From my understanding commerical traders are banks or other institutions whose purpose in the futures market is to buy an insurance policy in the form of a futures contract. The large traders sell that insurance policy and in lui of payment they recieve an opportunity to profit from the risk they assume and they determine the prices in the market. When the bulls are in charge the market goes up and when the bears are in charge the market goes down. We know who's in charge by reading the bottom of the page (timingcharts.com)under the chart where it says Net Position. We are trading with the Net Position. This means we are taking the long positions of the trader categories and subtracting the short positions to see whether the major traders are net long or short. If you add in the speculators the two sides become even. There always has to be a buyer for each seller. Go to www.cftc.gov for more info and the actual COT Data.
COT data comes out every Tuesday, but the charts dont update until Friday. As I stated earlier, fundamentals do not change quickly. This information is a week behind, but that should not make a big difference.
I hope I covered everything. If I did miss anything you should be able to figure it out by just looking at the COT Charts or by asking questions. When I started using the COT Charts I looked at them daily for a deep understanding, now I look at them once a week.
{Link Removed}