Thanks for the great info. Can you just show some fib levels, on 4hr charts
zee
Ignored
thx for the post.
do you have any perticular pair want me to see?
if you want to see any example of fib level on 4hr chart, i do have example at previous reply. pls check it out.
do you have any perticular pair want me to see?
if you want to see any example of fib level on 4hr chart, i do have example at previous reply. pls check it out.
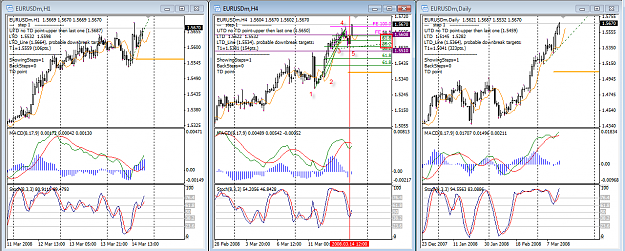
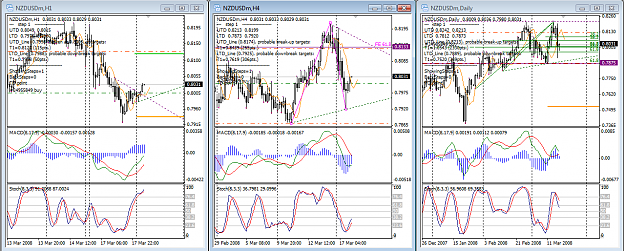
in eurusd, there is a small setup that bring some pips into acct. the number on the pic, indicate swing low. i didnt draw all the swing low out, because once i see sk form, or the 38.2 hold the price, i will reconize the lowest pt to start with. b/c there will be no meaning to keep drawing down for price not even touch it.
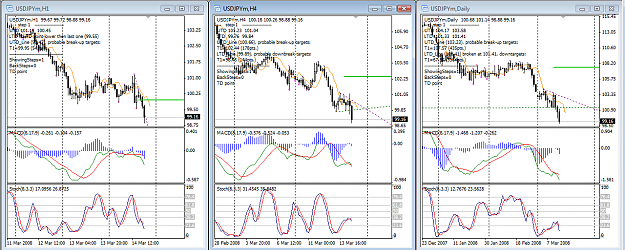
in usdjpy, it isnt fit the setup rule. b/c at the 4h orvesold pt, h macd still in uptrend side. i will skip this one and keep going to find the better setup.
more prefer setup is when 4h sto oversold/overbought close to 100 or pass over 100 line. please keep in mind.
otherwise, either sk hold price, otherwise, please trade very carefully with the setup that 4h sto didnt oversold/bought to 100 line.
p.s. eurusd setup form in 5am pst, i was in sleep. but the pt i want to show is you will not get every single setup to trade instead scanning through all 19 pairs (my broker provide) to find the setup when the time in your convenience.
in eurusd, there is a small setup that bring some pips into acct. the number on the pic, indicate swing low. i didnt draw all the swing low out, because once i see sk form, or the 38.2 hold the price, i will reconize the lowest pt to start with. b/c there will be no meaning to keep drawing down for price not even touch it.
in usdjpy, it isnt fit the setup rule. b/c at the 4h orvesold pt, h macd still in uptrend side. i will skip this one and keep going to find the better setup.
more prefer setup is when 4h sto oversold/overbought close to 100 or pass over 100 line. please keep in mind.
otherwise, either sk hold price, otherwise, please trade very carefully with the setup that 4h sto didnt oversold/bought to 100 line.
p.s. eurusd setup form in 5am pst, i was in sleep. but the pt i want to show is you will not get every single setup to trade instead scanning through all 19 pairs (my broker provide) to find the setup when the time in your convenience.
Ignored
Scrolling back on my charts, I do not see a single case of the stochastic ever being at the 100 or the 0 line.
What are the settings on your stochastic?
Low/High?
Close/Close?
Simple?
Exponential?
in eurusd, there is a small setup that bring some pips into acct. the number on the pic, indicate swing low. i didnt draw all the swing low out, because once i see sk form, or the 38.2 hold the price, i will reconize the lowest pt to start with. b/c there will be no meaning to keep drawing down for price not even touch it.
in usdjpy, it isnt fit the setup rule. b/c at the 4h orvesold pt, h macd still in uptrend side. i will skip this one and keep going to find the better setup.
more prefer setup is when 4h sto oversold/overbought close to 100 or pass over 100 line. please keep in mind.
otherwise, either sk hold price, otherwise, please trade very carefully with the setup that 4h sto didnt oversold/bought to 100 line.
p.s. eurusd setup form in 5am pst, i was in sleep. but the pt i want to show is you will not get every single setup to trade instead scanning through all 19 pairs (my broker provide) to find the setup when the time in your convenience.
Ignored
Hi Johntsai;
Thanks for your explaination; I am still not clear on a long setup,could you
please show me a present pair which has a long setup, and show how the Sto & macd work, would appreciate it
Thanks again
Zee
Thanks for your explaination; I am still not clear on a long setup,could you
please show me a present pair which has a long setup, and show how the Sto & macd work, would appreciate it
Thanks again
Zee
Ignored
hi zee,
i just check the chart tonit, i havnt locate any pair that have setup at this moment.
i suggest you go over the post #1 again due to the setup example is use uptrend to explain.
if you can specific the question you have, im sure it will be more helpful for me to help out.
p.s. here is how you can practice to find the past setup.
find the 4h sto o/s or o/b situation, then switch the chart to day an h to confirm macd direction. this will bring out the past example very easily.
I learned that Japan realse Tertiary Industry Report that jumping from -0.6% to +0.7%. No wonder there is a big movement in the chart and make new high in Jpy currency.
Since last night, I havnt caught any setup from the chart. Even this morning and Noon, chart still not showing any sign of setup either.
For the system trading style, all we want is a really good setup. Even we only caugh it once a week. Before, I was only trade EURUSD at last Sep 2007, and I can get a good result of double my balance. For this time, I am sure I can do even better then that. Due to all 19 pairs become my target of searching the Setup.
Last, I will post any new setup anytime, please come back often to check out. Also, if you have any suggestion, common, opinion, I am happy to hear from you.
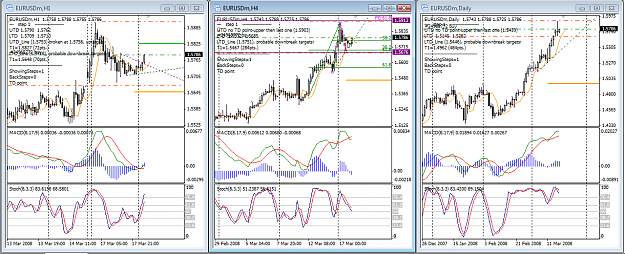
Your fib looks like it between the 61.8 and 38.2. It fell below the SK.
What justified the trade?
Ignored
actually the sk come form day chart. in day chart, price close right above the sk line. i havnt got chance to post it. please check it in your chart. i will try to post the complete setup tonit.
You don't have a MACD in the right direction, on the 4H EUR/USD.
Ignored
4h do not have to be in the same direction in order to get in.
as long as the rule apply to sto o/s situation that have sk/trendline to support, day and h macd have to be up for this trade, i will have taget and stop to open my position.
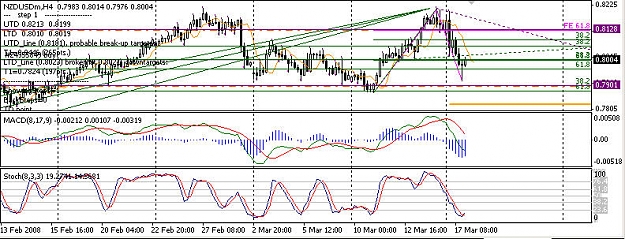
NZDUSD closed in 100pips profit. its closed enough to the target.
Position closed by time management technic.
EURUSD closed in 0 pips loss/profit.
Position closed by time management technic.
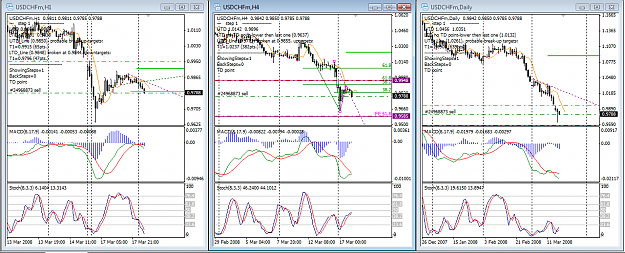
USDCHF keep open for 2 reason.
1. SK line havnt break
2. Due to position is in Loss situtaion, move target price higher to make sure target can close earlier to limit the risk.