|
Commercial Member
|
Joined Feb 2005
|2,875 Posts
damn that felt kinda good. i love my baby. she has been here from near the beginning when you never saw more than 30 people on this forum at one time. now its thousands and thousands. you done good merlin.
damn that felt kinda good. i love my baby. she has been here from near the beginning when you never saw more than 30 people on this forum at one time. now its thousands and thousands. you done good merlin.
jim
Ignored
There's a good reason a thread survives that long. It's because what's in it works
Would you recommend entering at this level because the price is also at a resistence?
Ignored
No, the only thing you can do is wait for price action in the resistance area for clues. But I dont sell tops or buy bottoms, I wait for things to get moving my way again before I get in, some people are good at that(buying tops and selling bottoms) but Im not...like I said before this looks like its going to close as a daily BUOB, but its going in the wrong direction for me personally...(or is it ?)take care, Raz
No, the only thing you can do is wait for price action in the resistance area for clues. But I dont sell tops or buy bottoms, I wait for things to get moving my way again before I get in, some people are good at that(buying tops and selling bottoms) but Im not...like I said before this looks like its going to close as a daily BUOB, but its going in the wrong direction for me personally...(or is it ?)take care, Raz
Ignored
Here are my observations -
1. Last week was a bullish pin confirmed by price action this week.
2. Yesterday Daily was a BuOVB
3. 4Hr is a BuOVB
4. 1 Hr closed as a 3 bar BuOVB
5. 1 hr close is above the resistance.
Here are my observations -
1. Last week was a bullish pin confirmed by price action this week.
2. Yesterday Daily was a BuOVB
3. 4Hr is a BuOVB
4. 1 Hr closed as a 3 bar BuOVB
5. 1 hr close is above the resistance.
Won't all these patterns indicate a bullish bias?
Ignored
on the short term, or for now maybe
but don't forget the overall trend is strongly down, which means, there will be bears lurking around a lot of corners :
when you see someone say pivot zone they are not necessarily referring to classic pivot points or floor trader pivots. its a term i use for flips in support and resistance over time.
jim
Ignored
Thanks for clearing that up jim, I used them and didn't even know people called them that
|
Joined Sep 2006
|
Status: momentum catcher
|213 Posts
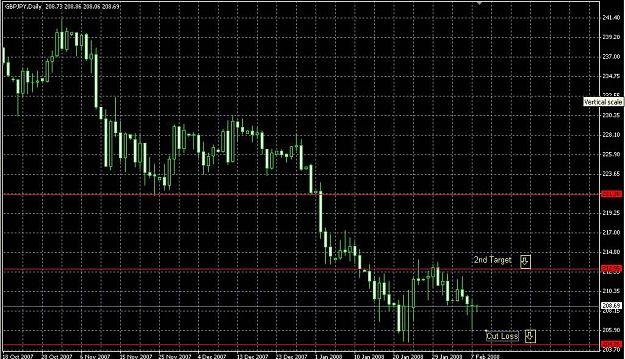
In two hours I'm going to get a new daily candle starting on my GBP/JPY, and if no major movement until then occur, it looks like we're going to have a nice looking pin bar. I'm very much interested in your opinions about it, would you take it norht, knowing that the overall trend is probably still down (although we did have it start moving up)? I won't have time posting it later, so posting the question now. Please, take a look at the screenshot. Thank you.
In two hours I'm going to get a new daily candle starting on my GBP/JPY, and if no major movement until then occur, it looks like we're going to have a nice looking pin bar. I'm very much interested in your opinions about it, would you take it norht, knowing that the overall trend is probably still down (although we did have it start moving up)? I won't have time posting it later, so posting the question now. Please, take a look at the screenshot. Thank you.
Ignored
The trend is far from down. We had a H&S on the weekly, but for us to see a confirmed bearish trend, we need to see a bounce off of that neckline at 217 and back down... only then would I say we're in a "downtrend".
And yes, I will be taking that trade...
If anything, I think we have a good possibility of a double bottom forming... let's see what happens when it hits 211.50 area...
Also, why are you targeting a Fib level that price has recently shot right through? You're limiting yourself IMO... I would target the 212 area and be done with it...the odds of it hitting 23.6 and then heading back down are low...
Also, why are you targeting a Fib level that price has recently shot right through? You're limiting yourself IMO... I would target the 212 area and be done with it...the odds of it hitting 23.6 and then heading back down are low...
Ignored
You're right, I don't remember what I was thinking while targetting 23.6 Thanks for your reply.
I would not take this trade because the nearest resistance line is too close to your entry point. You have 2 targets: the first one has a bad risk reward ratio and the second one is 1:1 risk reward ratio. I am sure there are/ will be better trades to get in.
I would not take this trade because the nearest resistance line is too close to your entry point. You have 2 targets: the first one has a bad risk reward ratio and the second one is 1:1 risk reward ratio. I am sure there are/ will be better trades to get in.
Ignored
I'm sorry, but I don't see any strong resistance too close, could you please clarify? Anyways, I wouldn't enter off the daily chart, I'll time my entry off a smaller tf, so the r:r will definitely be better than 1:1.
Joined Feb 2006
|
Status: 'Try-hard' extraordinaire...
|2,151 Posts
OK. My take on possible targets.
Not as clear cut a chart for targets that you CAN get.
I'm favouring the Blue Box, but will be keeping an eye on Mr Trends neckline. (lol) ...well price action around his neckline anyway.
The blue box takes into account a lot of my favourite targets, including probably the closest thing to a confluence at the large %38.2 fib.(the highest target.)
Then there are MAs. But until it happens...
My favourite price here is around 221.
So it looks like anywhere from 216.70 to 223. IF the pin carrys off.
I'm sorry, but I don't see any strong resistance too close, could you please clarify? Anyways, I wouldn't enter off the daily chart, I'll time my entry off a smaller tf, so the r:r will definitely be better than 1:1.
Ignored
I have to agree withadriana, 1st target is bad reward and rasio even 2nd target is bad r:r Entry will around : 209.61
Target profit around : 212.92
Cut Loss : 205.58
I have to agree withadriana, 1st target is bad reward and rasio even 2nd target is bad r:r Entry will around : 209.61 Target profit around : 212.92 Cut Loss : 205.58
Your risk is the money you potentially may lose, not including the potential profit. So, if you decided that your entry will be 209.61, then your risk would be 209.61 - 205.58 = 403 pips.
While I agree that the pair has been trending down for quite a while, it does show strong signs of a reversal though. So, in determining your r:r, you also should include the probability of a trade working out. It doesn't even have to be a big reversal, two bullish daily candles will yield planty of gracious pips