I'm usually a pretty quick study on the rules of methods but after reading through post#1 ten or so times I find that I'm just not understanding it. No offense to the author who has been kind enough to share his work, but would someone who understands the method please explain it briefly (perhaps with a simple example)? Maybe I just need to see the rules rephrased in someone else's words...
You're not alone Lou, I'm struggling to grasp it also - someone please help with an annotated diagram!
1-Identify a pivot high bar on daily chart, that is a bar which has a bar on each side with lower highs
2-Short set-up is break of the low of the pivot high bar, if:
a) RSI 10 is hooking down from 70 level and crossed 60 level OR
b) if RSI has not reached 70 level, it has crossed 50 level
Initial stop is above the high of the pivot bar or 100 pips whichever is less.
Stepped stops are above the high of previous day's bar when a daily bar closes.
There is no set target, exit on stop-out.
The reverse applies to long entries with the exception that spread should be added to the trigger level which is top of the pivot low bar.
The method has nothing to do with calculated daily pivot lines.
Has anyone noted the gbp/usd pivot point from 1/8, the number would be 1.9391, however since the rsi is flat is anyone going to go long on this.
Ignored
I'm long on the 01/08 pivot @1.9413 (price exeeded the magic number after the closing bar yesterday rather quickly and I jumped- but this is demo). RSI was above 30 and and approaching 40 at the time I entered.
S/L @ 1.9313.
This position was in profit by more than 40 pips at one point since entering, but as I said- it's a demo and I'm testing the system. We shall see...
Joined Dec 2006
|
Status: call me Kevin
|1,263 Posts
Alright, this is going to be a long one...
Quoting dave1964
Disliked
I hope I have this right, to determine a max high or low a bar closes and the previous bar is lets say is lower than todays bar, then todays bar closes and the next bar also is lower, so our day 2 bar would be a high point? Then we would use the low end of the day 2 bar as our target number to sell plus the spread? So should we be looking at 3 bars to determine our projections?
Thanks.
Ignored
Dave,
I am currently driving from Indiana to Texas, and was up late last night at a going away party. This being said, I'm not sure if I'm just really tired and out of it, or this question is very wordy! If you could please find a visual example of your question, I think this would make it easier for the both of us : My apologies
Quote
Disliked
Hey kharvell,
Thanks for sharing your system. I must have the same broker as fjfx, because I'm in on the same signal. The magic number was hit right after the close of yesterday's bar.
First and foremost, thank YOU for thanking ME! Secondly, I'm happy to see that you have spotted the pivot, and you are checking the signal to make sure it qualifies. I still haven't gotten a BUY yet for cable, but that's not to say you didn't make the right trade! It looks as though it might range for a little bit, but we'll see what happens I guess! Good luck to you
Quote
Disliked
Very clever Antra - how did you get the two RSI's into the same chart window (I'm assuming that's MT4 I'm looking at)?
Oh wow, I didn't even notice the 2 RSI's
Antra do you have any thoughts on which RSI appears to be better looking at history?
Thanks
Quote
Disliked
I'm usually a pretty quick study on the rules of methods but after reading through post#1 ten or so times I find that I'm just not understanding it. No offense to the author who has been kind enough to share his work, but would someone who understands the method please explain it briefly (perhaps with a simple example)? Maybe I just need to see the rules rephrased in someone else's words...
Thank you,
Lou G
You're not alone Lou, I'm struggling to grasp it also - someone please help with an annotated diagram!
1-Identify a pivot high bar on daily chart, that is a bar which has a bar on each side with lower highs
2-Short set-up is break of the low of the pivot high bar, if:
a) RSI 10 is hooking down from 70 level and crossed 60 level OR
b) if RSI has not reached 70 level, it has crossed 50 level
Initial stop is above the high of the pivot bar or 100 pips whichever is less.
Stepped stops are above the high of previous day's bar when a daily bar closes.
There is no set target, exit on stop-out.
The reverse applies to long entries with the exception that spread should be added to the trigger level which is top of the pivot low bar.
The method has nothing to do with calculated daily pivot lines.
I hope this clarifies.
I would like to apologize first! I am quick to learn things, but HORRIBLE at teaching.. So I'm sorry that my first post isn't the best. :
And howard, I would like to thank you for your very simple display of my system. This would be a perfect "cheat sheet" to print out for people just starting. Thanks for taking your time to do that!
Alright, I think I've got most of the posts out of the way there
Now, the good stuff
I have just entered a few trades and stopped out on some old ones I had..
I would like to show you the process for clarification:
First of all,
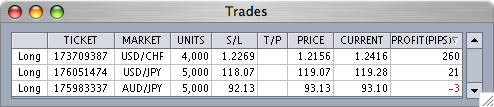
Here are my completed trades so far with forward testing:
SHORT GBP/USD @ 1.9636 Stopped out 1.9436 = 200PIPS
SHORT USD/JPY @ 118.64 Stopped out 119.07 = -43 PIPS
SHORT AUD/JPY @ 94.31 Stopped out 93.13 = 118 PIPS
And I still have my USD/CHF trade
Here are the current trades I have, I will post some graphs to walk you through in a little bit:
Joined Dec 2006
|
Status: call me Kevin
|1,263 Posts
Alright then
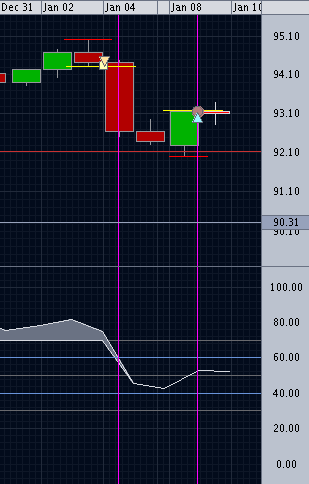
Same drill as always, but these are actual trades not hypothetical:
Red Lines: Max/Min
Yellow Lines: Magic #
Purple Lines: Me checking the RSI
Down arrows: Sell positions start
Up arrows: Buy positions start
Red Circles: Stop loss hit
Unfortunately, My graphs are littered with dots and arrows from when I used to trade on short term, so I can only offer you this AUD/JPY graph.
Joined Dec 2006
|
Status: call me Kevin
|1,263 Posts
Quote
Disliked
Quote:
Hey kharvell,
Thanks for sharing your system. I must have the same broker as fjfx, because I'm in on the same signal. The magic number was hit right after the close of yesterday's bar.
First and foremost, thank YOU for thanking ME! Secondly, I'm happy to see that you have spotted the pivot, and you are checking the signal to make sure it qualifies. I still haven't gotten a BUY yet for cable, but that's not to say you didn't make the right trade! It looks as though it might range for a little bit, but we'll see what happens I guess! Good luck to you
It has just occurred to me why, you are in this trade and I am not! The answer is that I do not include Sundays in my data, and I believe that is where your low pivot has happened.. Let me know if I am right on this!
It has just occurred to me why, you are in this trade and I am not! The answer is that I do not include Sundays in my data, and I believe that is where your low pivot has happened.. Let me know if I am right on this!
Ignored
No, my daily chart from InterbankFX has the Friday, January 5th low of 1.9264, the next (regular) daily bar I used was Monday, January 8th's, which had a low of 1.9262- only 2 pips lower- but still technically a low-pivot bar, no?
My guess is that you're not in the trade because your broker's data was just slightly different.
I know two pips on a daily is like a freckle on an elephant's butt- but I really wanted to test this thing out.
Joined Dec 2006
|
Status: call me Kevin
|1,263 Posts
Quoting kenmania
Disliked
No, my daily chart from InterbankFX has the Friday, January 5th low of 1.9264, the next (regular) daily bar I used was Monday, January 8th's, which had a low of 1.9262- only 2 pips lower- but still technically a low-pivot bar, no?
My guess is that you're not in the trade because your broker's data was just slightly different.
I know two pips on a daily is like a freckle on an elephant's butt- but I really wanted to test this thing out.
ken
Ignored
Good analogy there Ken, and I hope your trade works out
I'm supposing that we have different brokers, but essentially, you have the fundamentals of my system to a T! The recent minimum I have for GBP/USD is 1.9248 and the magic # is around 1.945. However, the RSI for one DID NOT go to 30, so it DOES NOT qualify, we will see in the future whether or not we missed out or not! If it is to go above 50 within the next couple of days, then we will buy! I will post when and IF I enter a long trade!
Hope this helps! Good luck
Ignored
Hi kharvell
Thanks for all your replies. Appreciate them.
Cheers
fj
Alright then
Same drill as always, but these are actual trades not hypothetical:
Red Lines: Max/Min
Yellow Lines: Magic #
Purple Lines: Me checking the RSI
Down arrows: Sell positions start
Up arrows: Buy positions start
Red Circles: Stop loss hit
Unfortunately, My graphs are littered with dots and arrows from when I used to trade on short term, so I can only offer you this AUD/JPY graph.
Hope it helps,
Kevin
Ignored
Hi Kevin
Thanks for your example on AUD/JPY. I think I fully understand your
entry triggers, but could you kindly clarifiy your stepped stop loss.
In your example, you
Short Aug/JPY on 4 Jan; so initial stop loss is High of 3 Jan
Then, as soon as 4 Jan candle closes, you move stop to High of 4 Jan.
Again, as soon as 5 Jan candle closes, you move stop to High of 5 Jan
Am I correct so far??
Then, on 8th Jan, shouldn't you be stopped out at the High of 5 Jan??
(as compared to your "red circle on 8 Jan)
Next, how about the Long trigger?
You now use the High of 8 Jan + spread as the magix no trigger?
So, you entered long on 9 Jan? Correct?
Apologies in advance, but I'm trying to follow your thought process.
Joined Dec 2006
|
Status: call me Kevin
|1,263 Posts
Quoting fjfx
Disliked
Hi Kevin
Thanks for your example on AUD/JPY. I think I fully understand your
entry triggers, but could you kindly clarifiy your stepped stop loss.
In your example, you
Short Aug/JPY on 4 Jan; so initial stop loss is High of 3 Jan
Then, as soon as 4 Jan candle closes, you move stop to High of 4 Jan.
Again, as soon as 5 Jan candle closes, you move stop to High of 5 Jan
Am I correct so far??
Then, on 8th Jan, shouldn't you be stopped out at the High of 5 Jan??
(as compared to your "red circle on 8 Jan)
Next, how about the Long trigger?
You now use the High of 8 Jan + spread as the magix no trigger?
So, you entered long on 9 Jan? Correct?
Apologies in advance, but I'm trying to follow your thought process.
Thanks
fj
Ignored
Very good questions fjfx,
Although JAN 5th could have been my stoploss and it would have been better, according to my system, Jan 7th had a lower low. This indicates that IT has to be the next pivot point; therefore i was looking to sell at IT'S high.. As you know, markets go either up or down, and I was hoping for down, but up came instead, so my new pivot stopped me out... Hope that makes sense
And as far as my long trade, that's exactly what I did.. I think it actually happened at 22:13 on Jan 8th, but that's because I have been driving all day, and didn't want to miss the opportunity, so just placed the order last night. (Close enough )
Could you explain how you came up with an entry for short on cable at 1.9334? I'm missing it.
Ignored
Okay, I saw this on the Daily Cable Analysis thread-
Quote
Disliked
Yes, I usually just add the spread to a recent minimum or maximum on daily, and that's my target. I also use RSI to tell me if it's a good time to buy or sell.
I was under the impression that the rule was to trade at the end of a pivot bar? I can see that yesterday's bar was a pivot, but the current bar? How can it be determined a pivot so early in the day?
Joined Dec 2006
|
Status: call me Kevin
|1,263 Posts
Quoting kenmania
Disliked
Hi kharvell, me again.
Could you explain how you came up with an entry for short on cable at 1.9334? I'm missing it.
Ignored
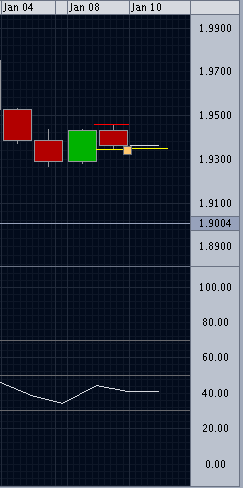
Well Ken,
We've found that we all get different #'s with different brokers.. I use OANDA, and they are telling me that January 9th produced a high of 1.9456, so I'm using the low of 1.9342 plus some as a # to get in.. Here's a picture for you:
Joined Dec 2006
|
Status: call me Kevin
|1,263 Posts
Quoting kenmania
Disliked
Okay, I saw this on the Daily Cable Analysis thread-
I was under the impression that the rule was to trade at the end of a pivot bar? I can see that yesterday's bar was a pivot, but the current bar? How can it be determined a pivot so early in the day?
Ignored
Ahhh you make a good point.. I guess you could say that I'm betting that an outside bar won't occur. By this I mean, that if it makes a lower low, then it more than likely won't make a higher high..
Adding a bit more risk... Typically, I will check throughout the day, but as I will be driving all day tomorrow, it's not going to happen
We've found that we all get different #'s with different brokers.. I use OANDA, and they are telling me that January 9th produced a high of 1.9456, so I'm using the low of 1.9342 plus some as a # to get in.. Here's a picture for you:
I remember you saying you're long correct?
Ignored
Yep, long. Forgive me but it seems like determining the entry is kind of discretionary. A "recent low" could be any low, couldn't it?
Ahhh you make a good point.. I guess you could say that I'm betting that an outside bar won't occur. By this I mean, that if it makes a lower low, then it more than likely won't make a higher high..
Adding a bit more risk... Typically, I will check throughout the day, but as I will be driving all day tomorrow, it's not going to happen
Ignored
Okay. You're trading your system very loosley in other words. Gotchya.