Just the facts:
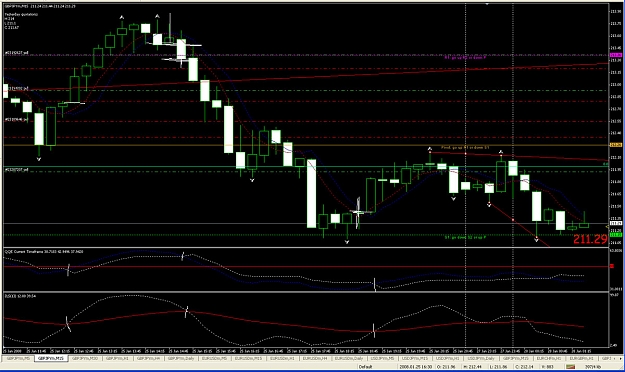
- There are no clear trade signals right now.
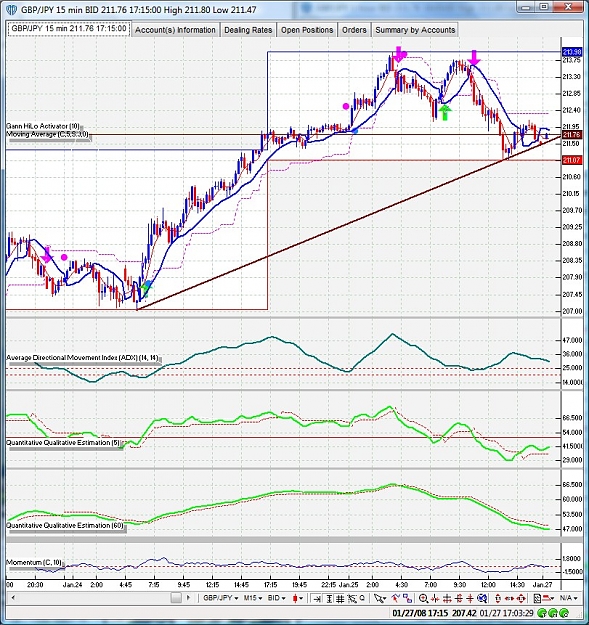
- QQE indicators are mixed, depending on the time frame.
- Momentum indicators are mixed, depending on time frame.
- ADX indicators on both the 15M and 1H charts show a trending market (above 25).
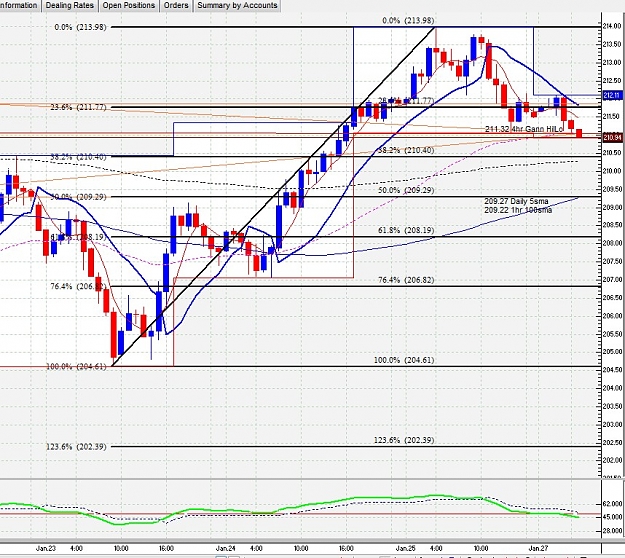
- Price is well above the Daily 5sma and the 1hr 100sma.
- Price found resistance in the 214 area on Friday, and it held through the weekend.
- Price found support in the 211 area on Friday, and it held through the weekend.
Less concrete, but generally accepted:
- Normal ranging could occur anywhere between Friday’s high and Friday’s low.
- A break above this range would suggest a continuation to the next level of resistance. A break below would suggest downward movement to the next level of support.
- If you draw a simple trend line from Thursday, the obvious trend is up. If price actually keeps following this trend line, it would be a very nice bullish sign.
- If price dips below the trend line, it should not be considered a bearish sign on it’s own. Price tends to range or consolidate between significant moves, so it would more likely indicate “sideways” movement instead of “downward”.
Things to watch for:
- Possible “15 minute strategy” long trade in the near future. Let’s see if the upward swing can break the current range. If it does, 215 will be looking good for today.
- If price breaks the lower range, make sure you have a clear trade with price at least below the Daily 5sma and the 1hr 100sma before going short.
- If we’re range bound and there are no high quality trades, it might be a good time to try some of our new scalping strategies with decreased lot sizes, or on demo.
![]()
Attached Image (click to enlarge)